

Climate Matters
2025 Winter Package
Winters have warmed by 3.9°F on average across 239 U.S. cities since 1970. Warmer, shorter winters have lingering effects on health, water supplies, and agriculture throughout the year.

Climate Briefings•November 1, 2025
Dr. Zachary Labe, climate scientist at Climate Central, said:
“Despite early-season snow and a few notable cold spells across northern and eastern parts of the country, November still ranked among the top five warmest on record for the U.S. In a warming world, we will continue to see snow and extreme cold, but these events are becoming the exceptions rather than the rule, and that shift is reshaping our landscape and environment.”
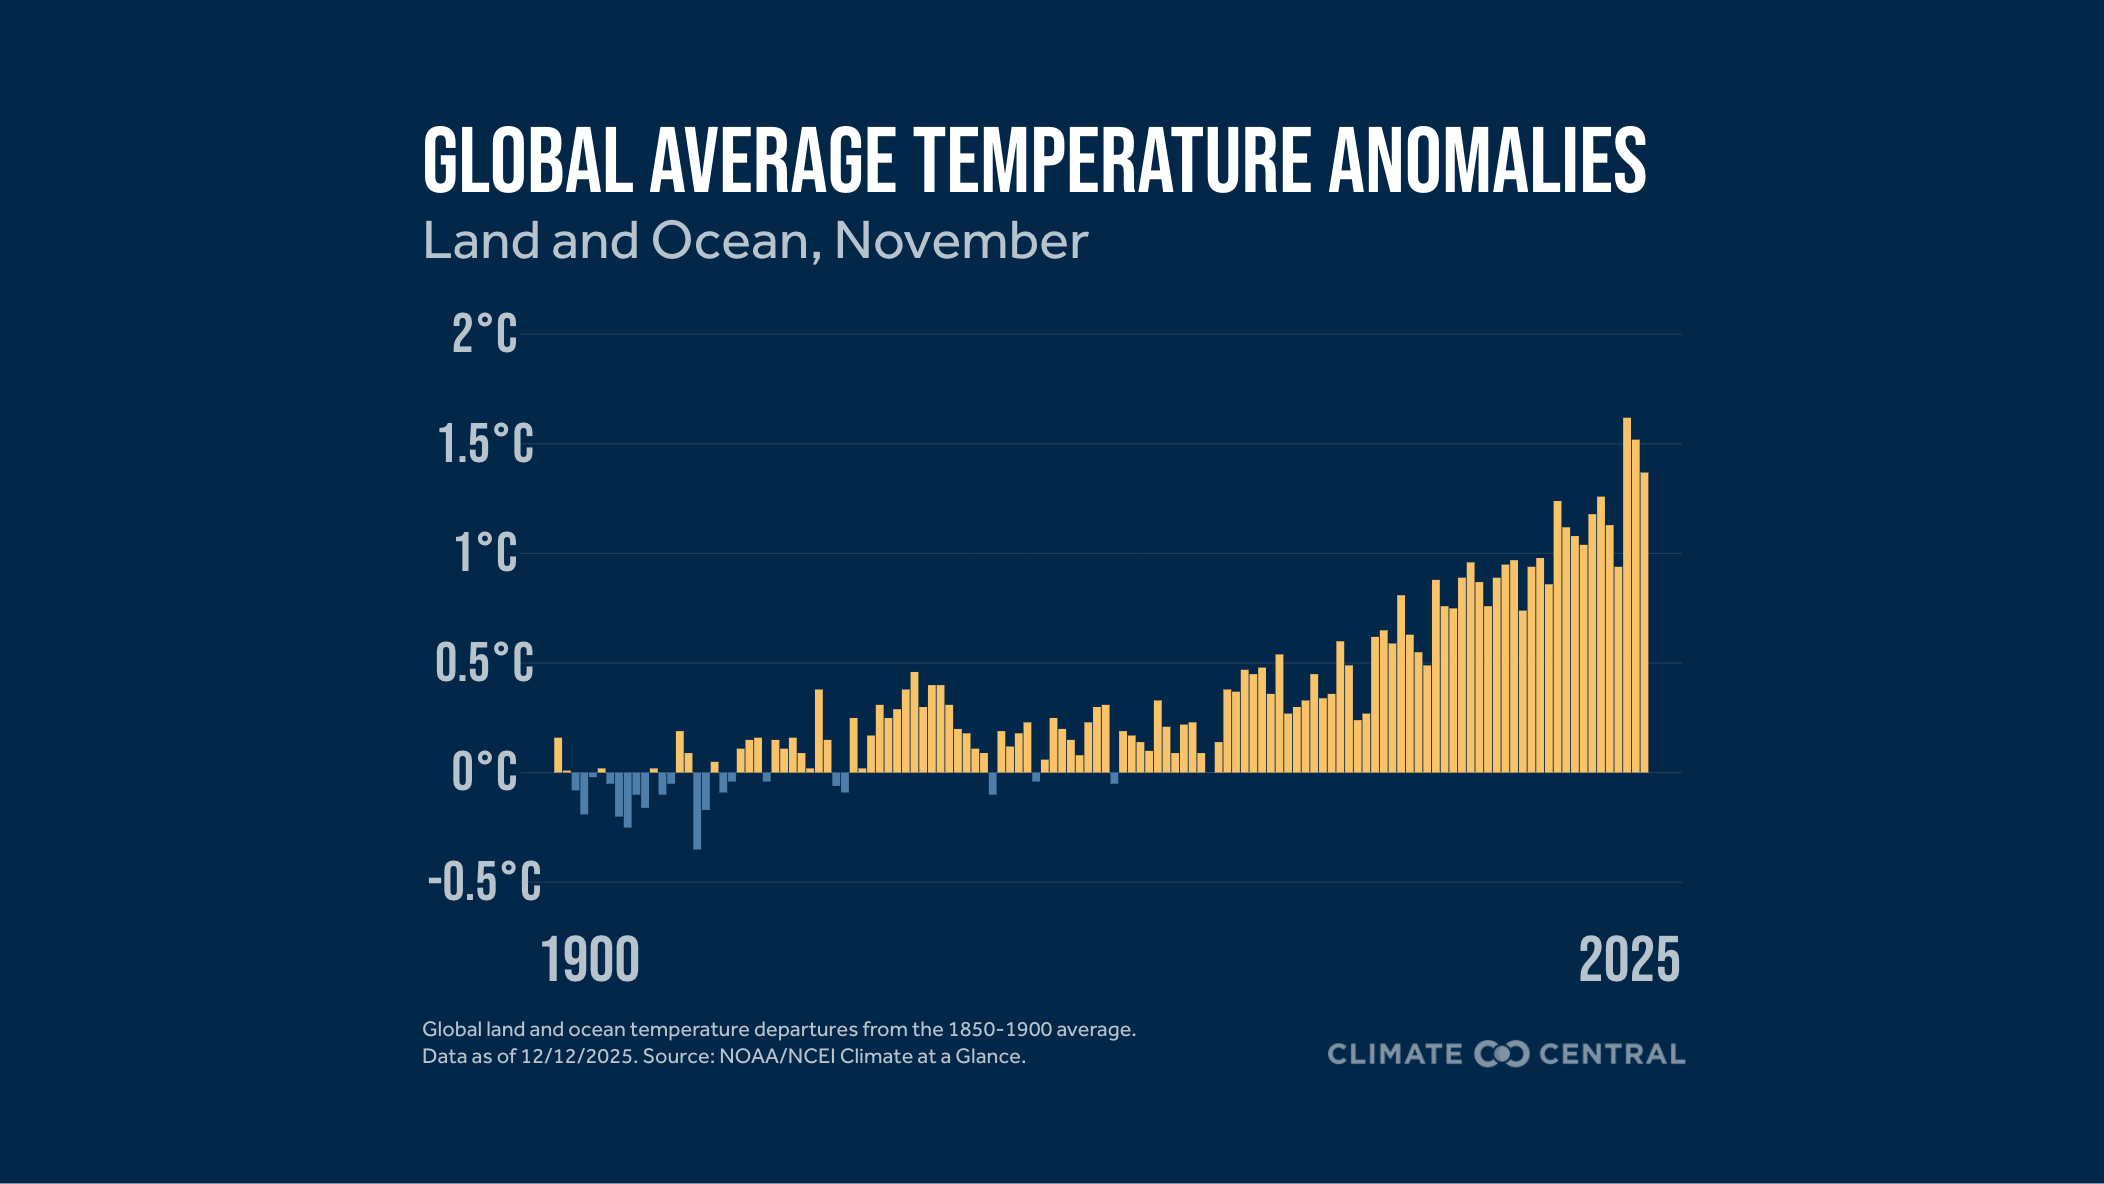
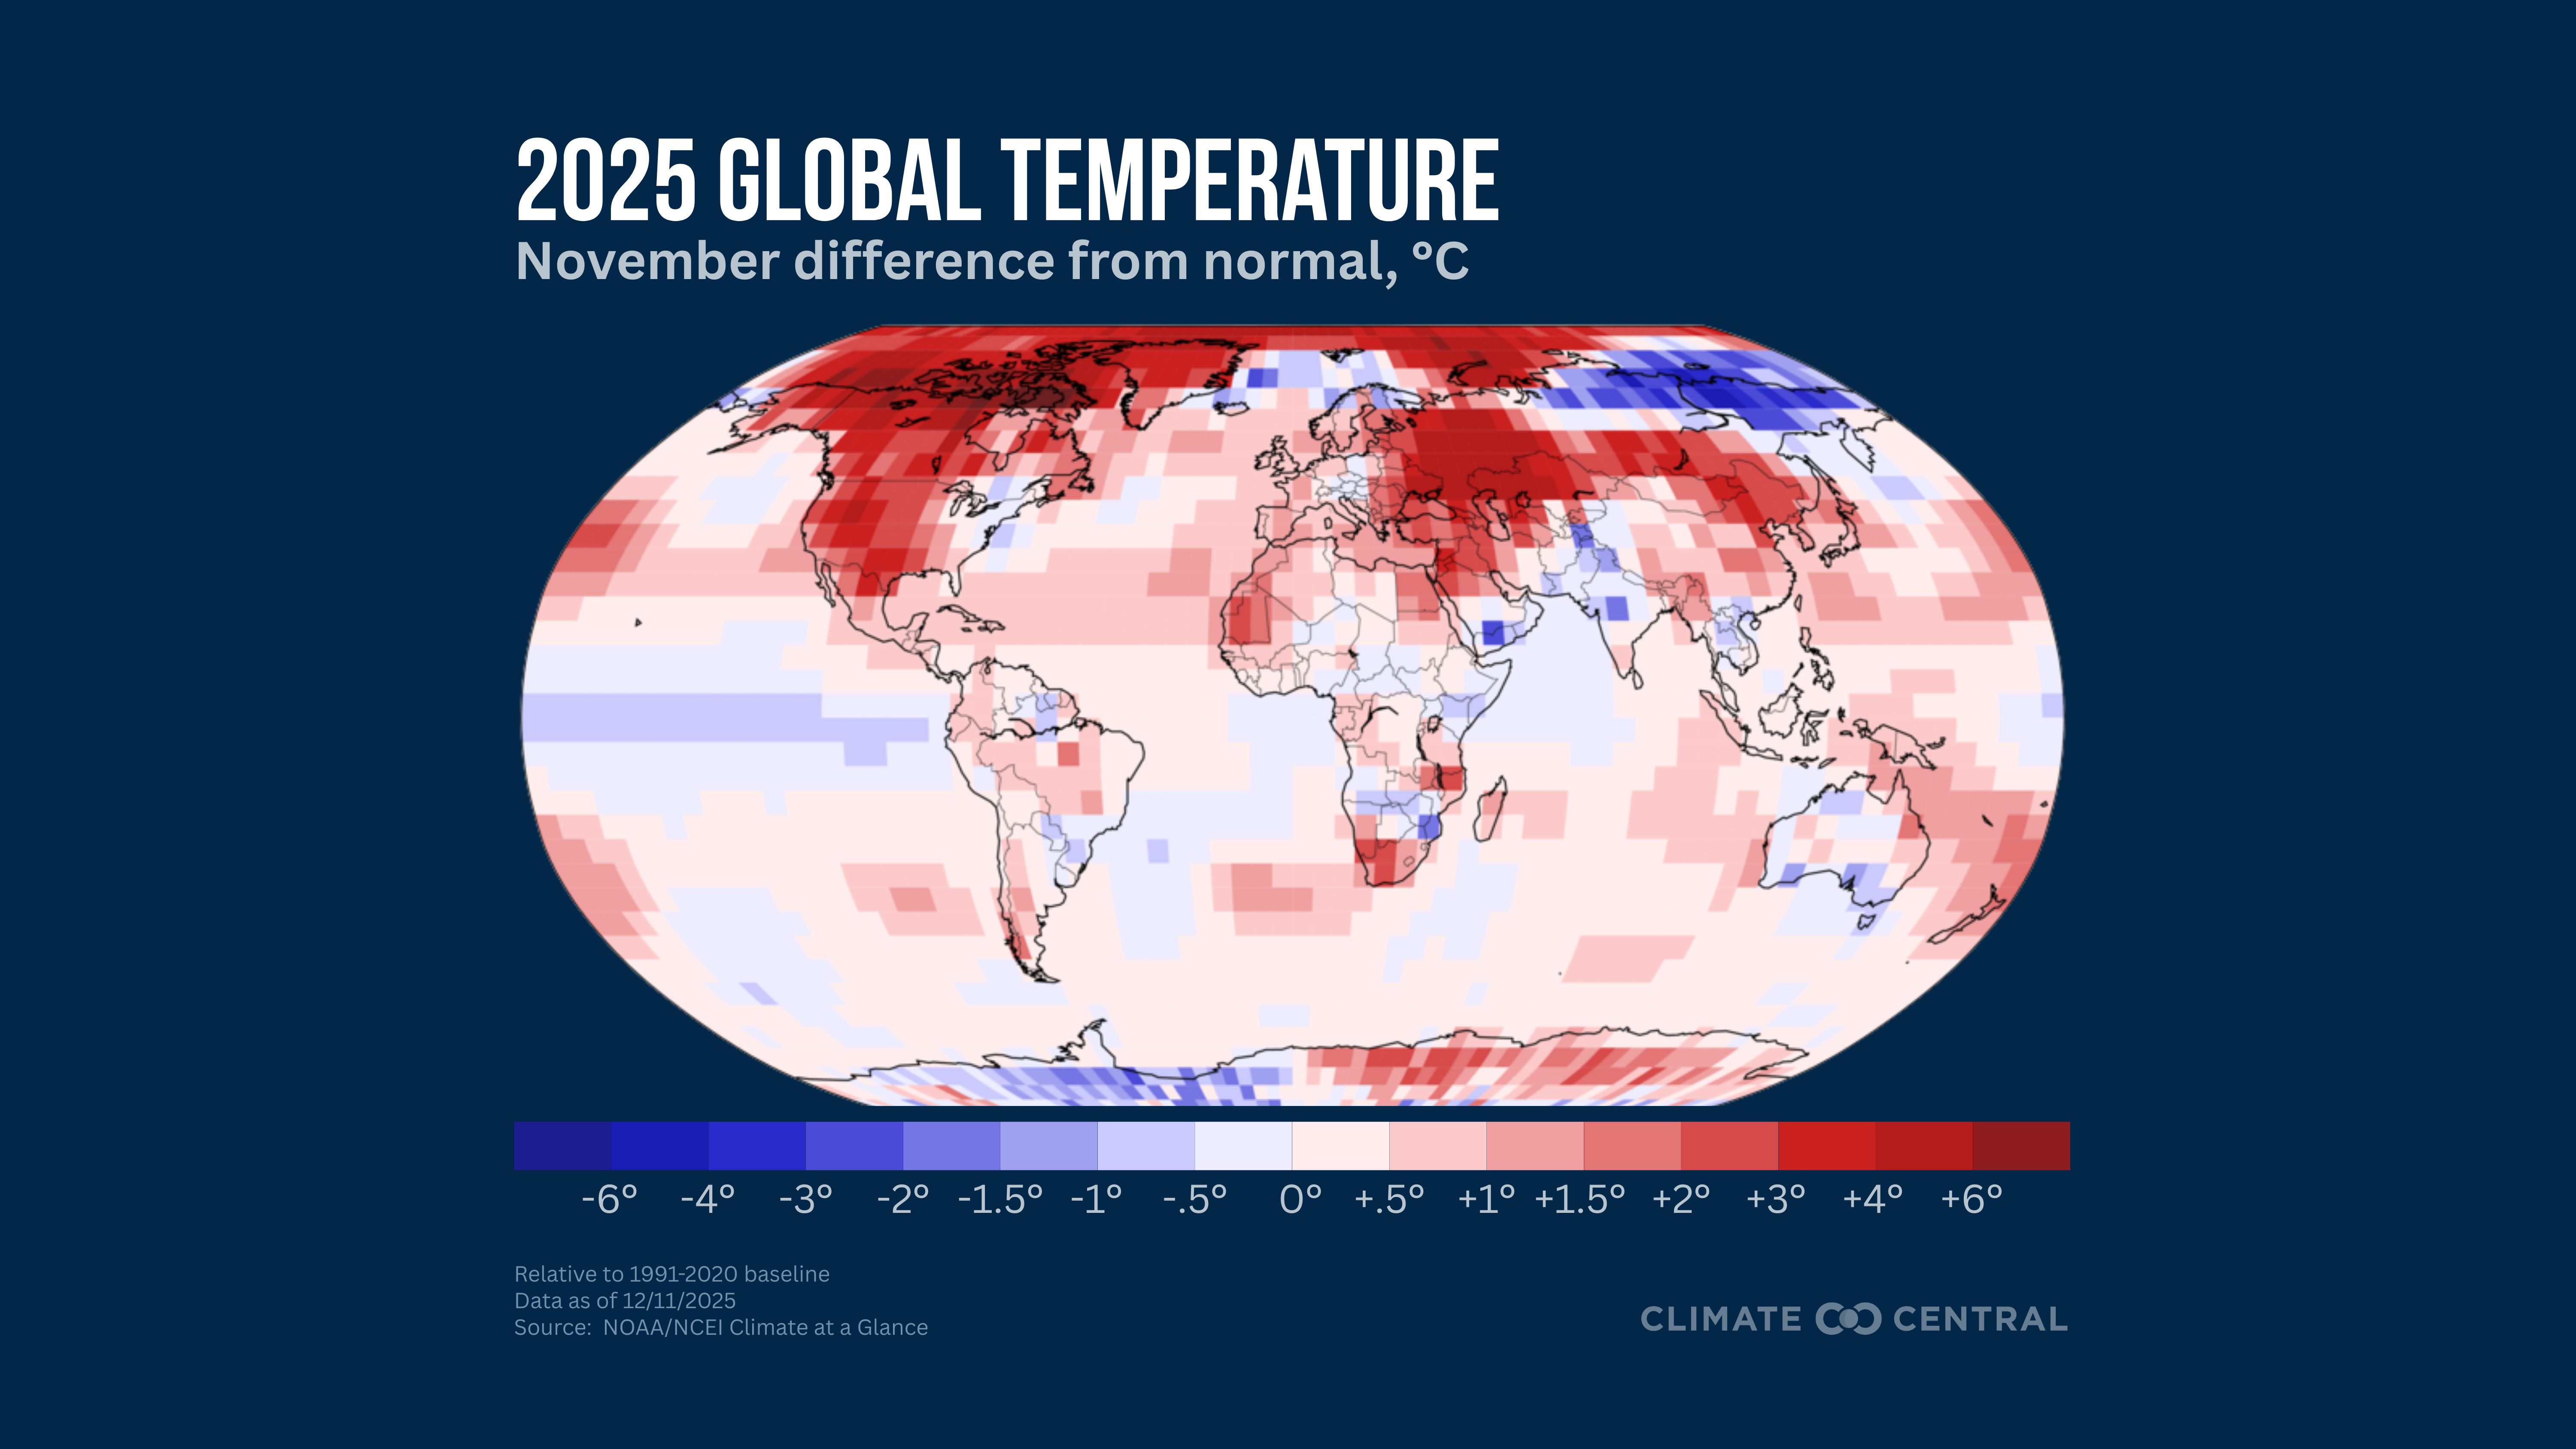
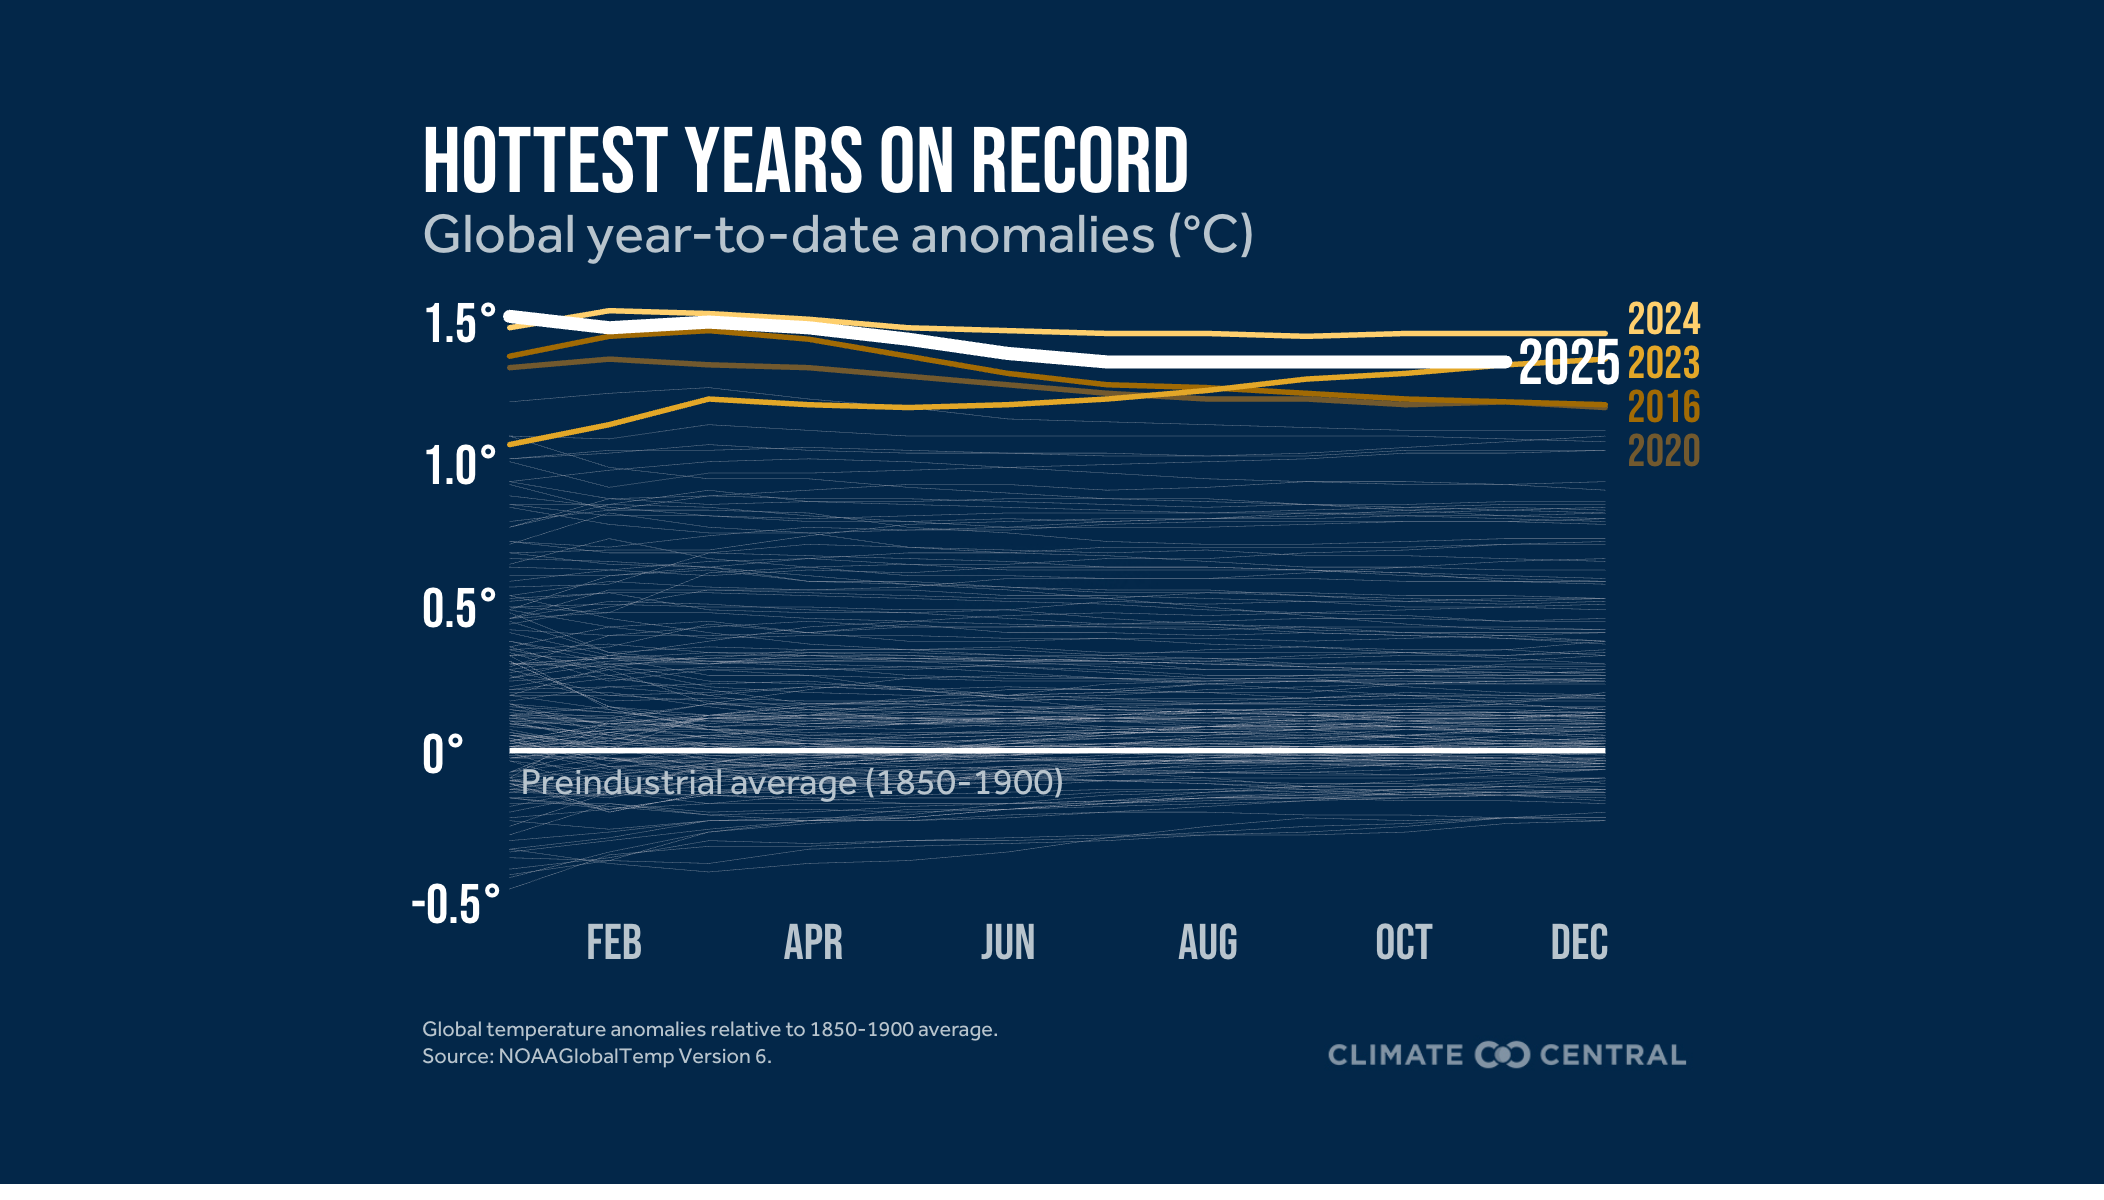
November 2025 was the third warmest on record globally (for land and ocean temperatures combined). Records have been kept since at least 1850.
All of the ten hottest Novembers on record globally have happened since 2015.
Global average temperatures over land areas were the fourth warmest on record in November.
The last time November’s global mean temperature was cooler than normal (compared to the 20th century average) was in 1976.
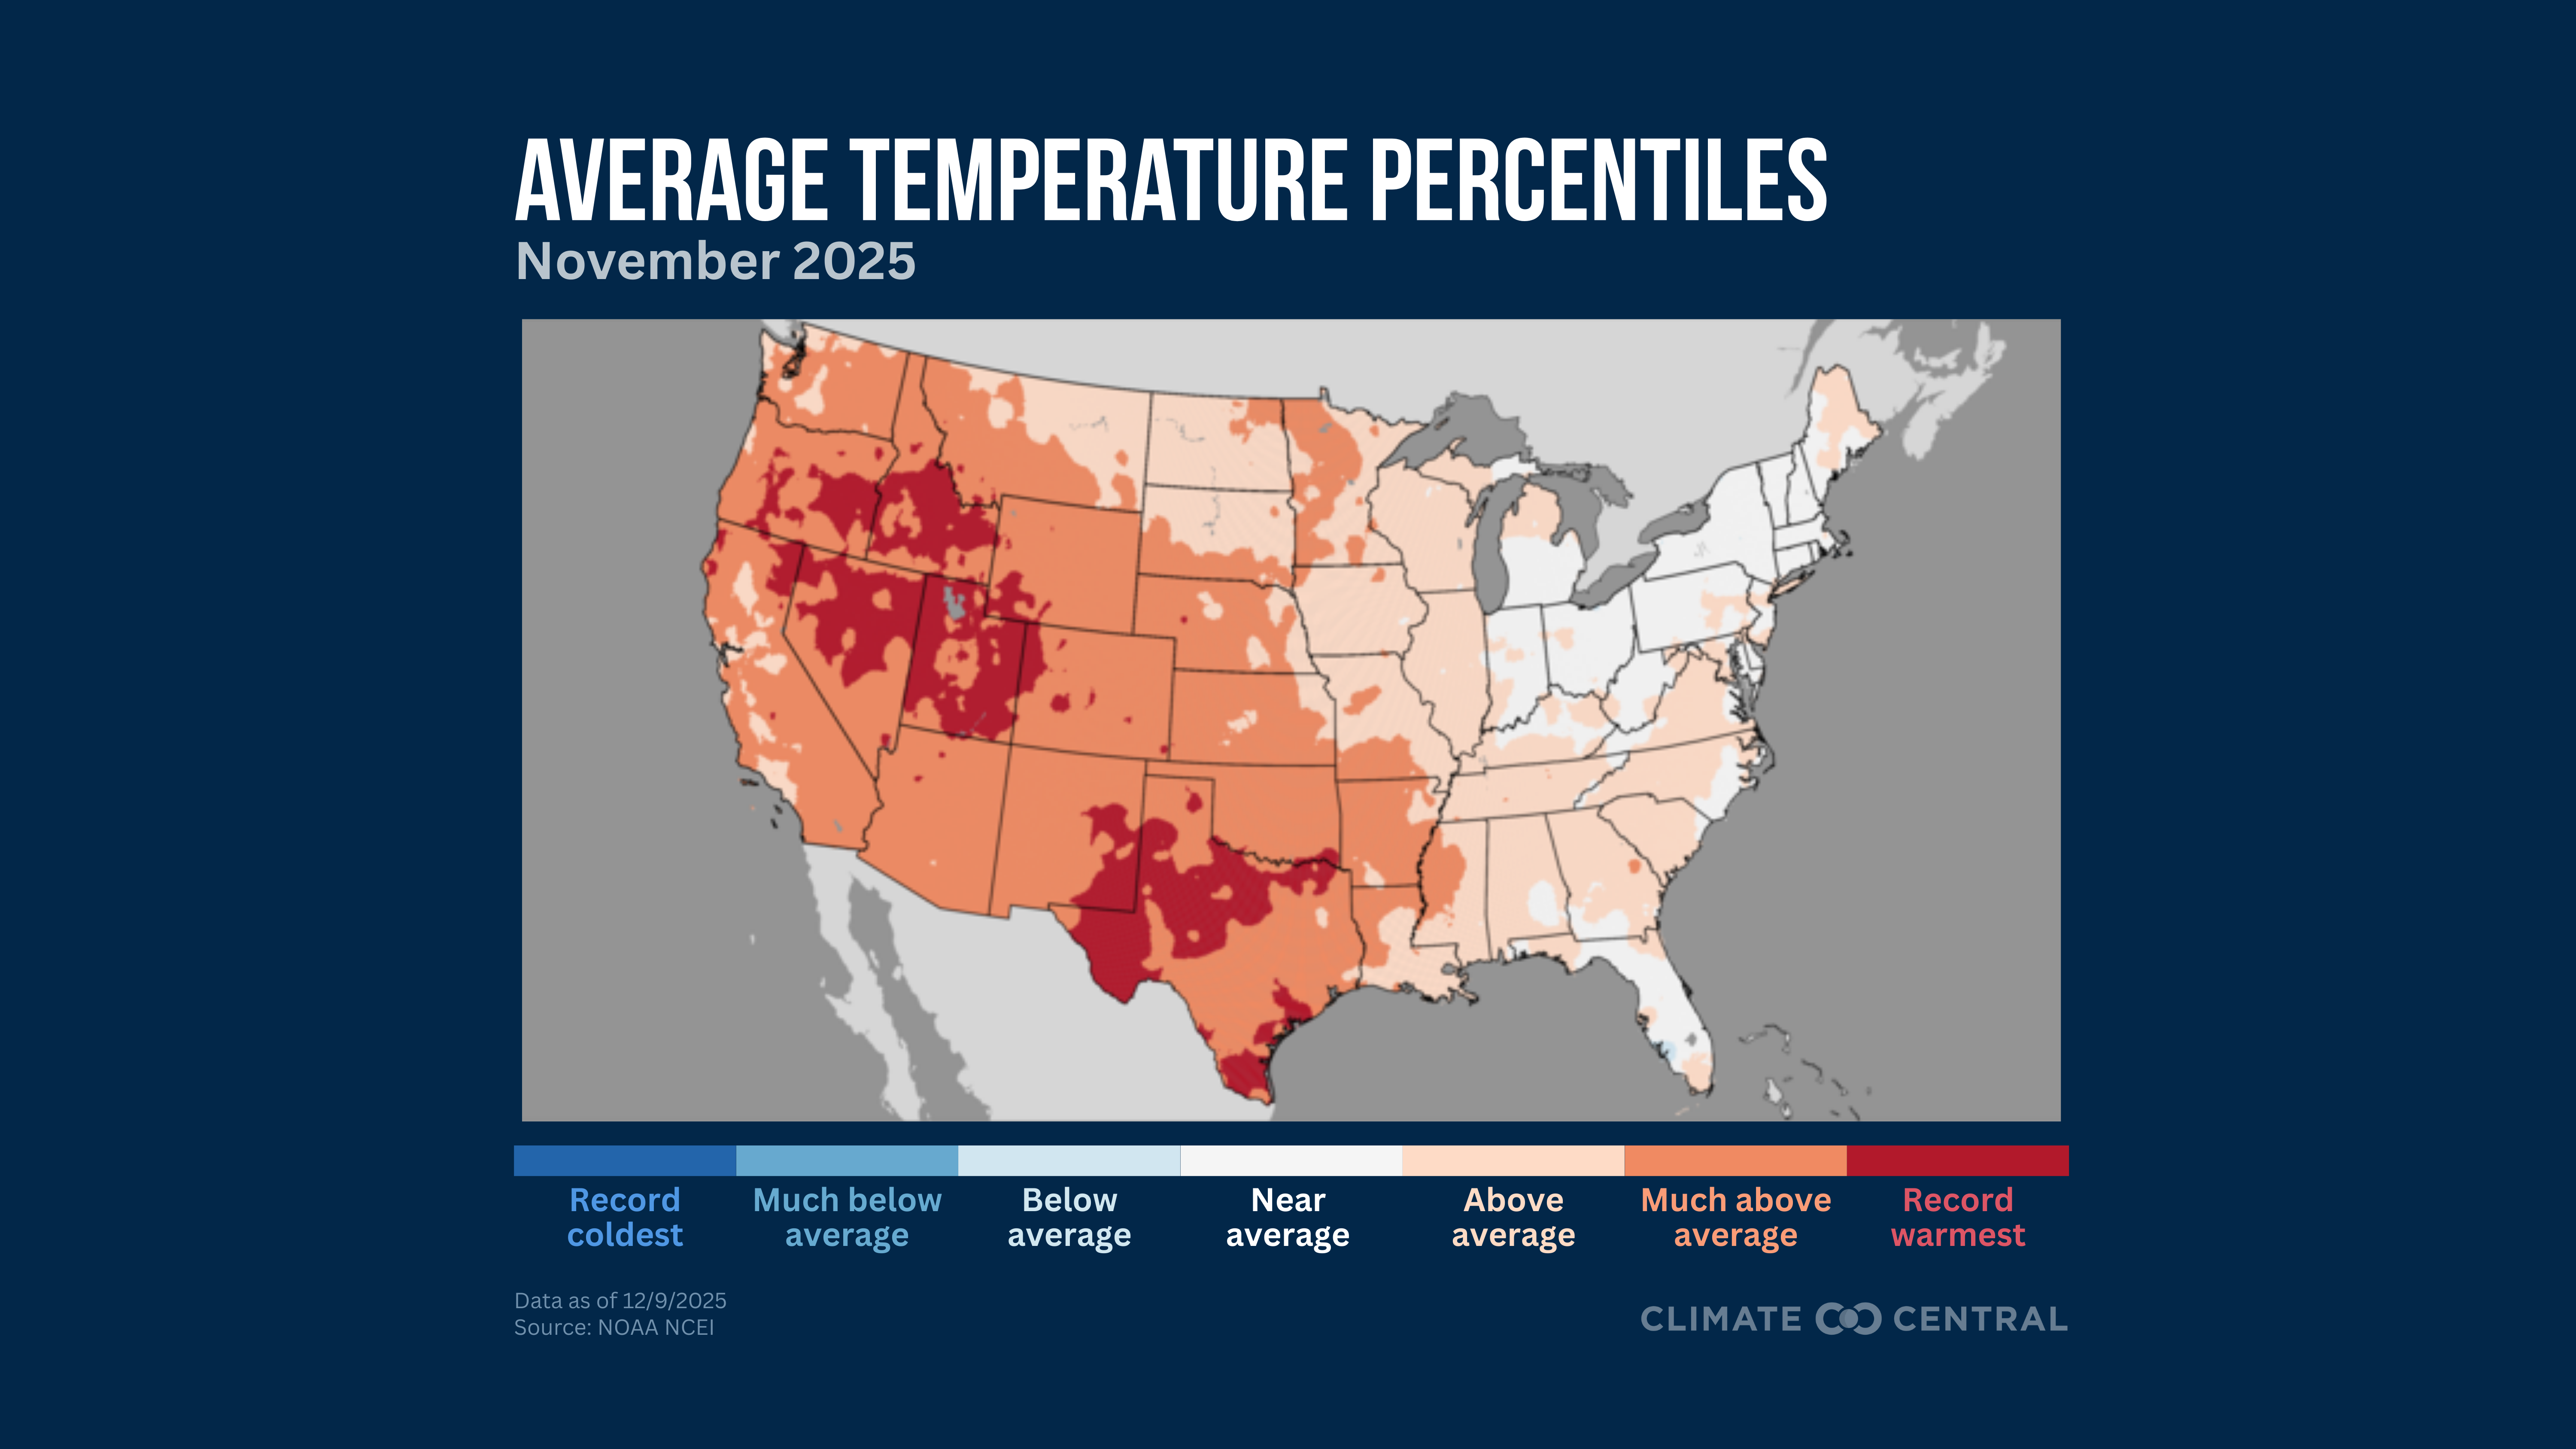
The largest deviations of above-normal temperatures were observed across the Canadian Arctic, the western U.S., and eastern Europe in November.
Temperatures were cooler than normal across parts of eastern Siberia, southern Africa, southeast Asia, and Australia, compared to the 1991-2020 baseline.
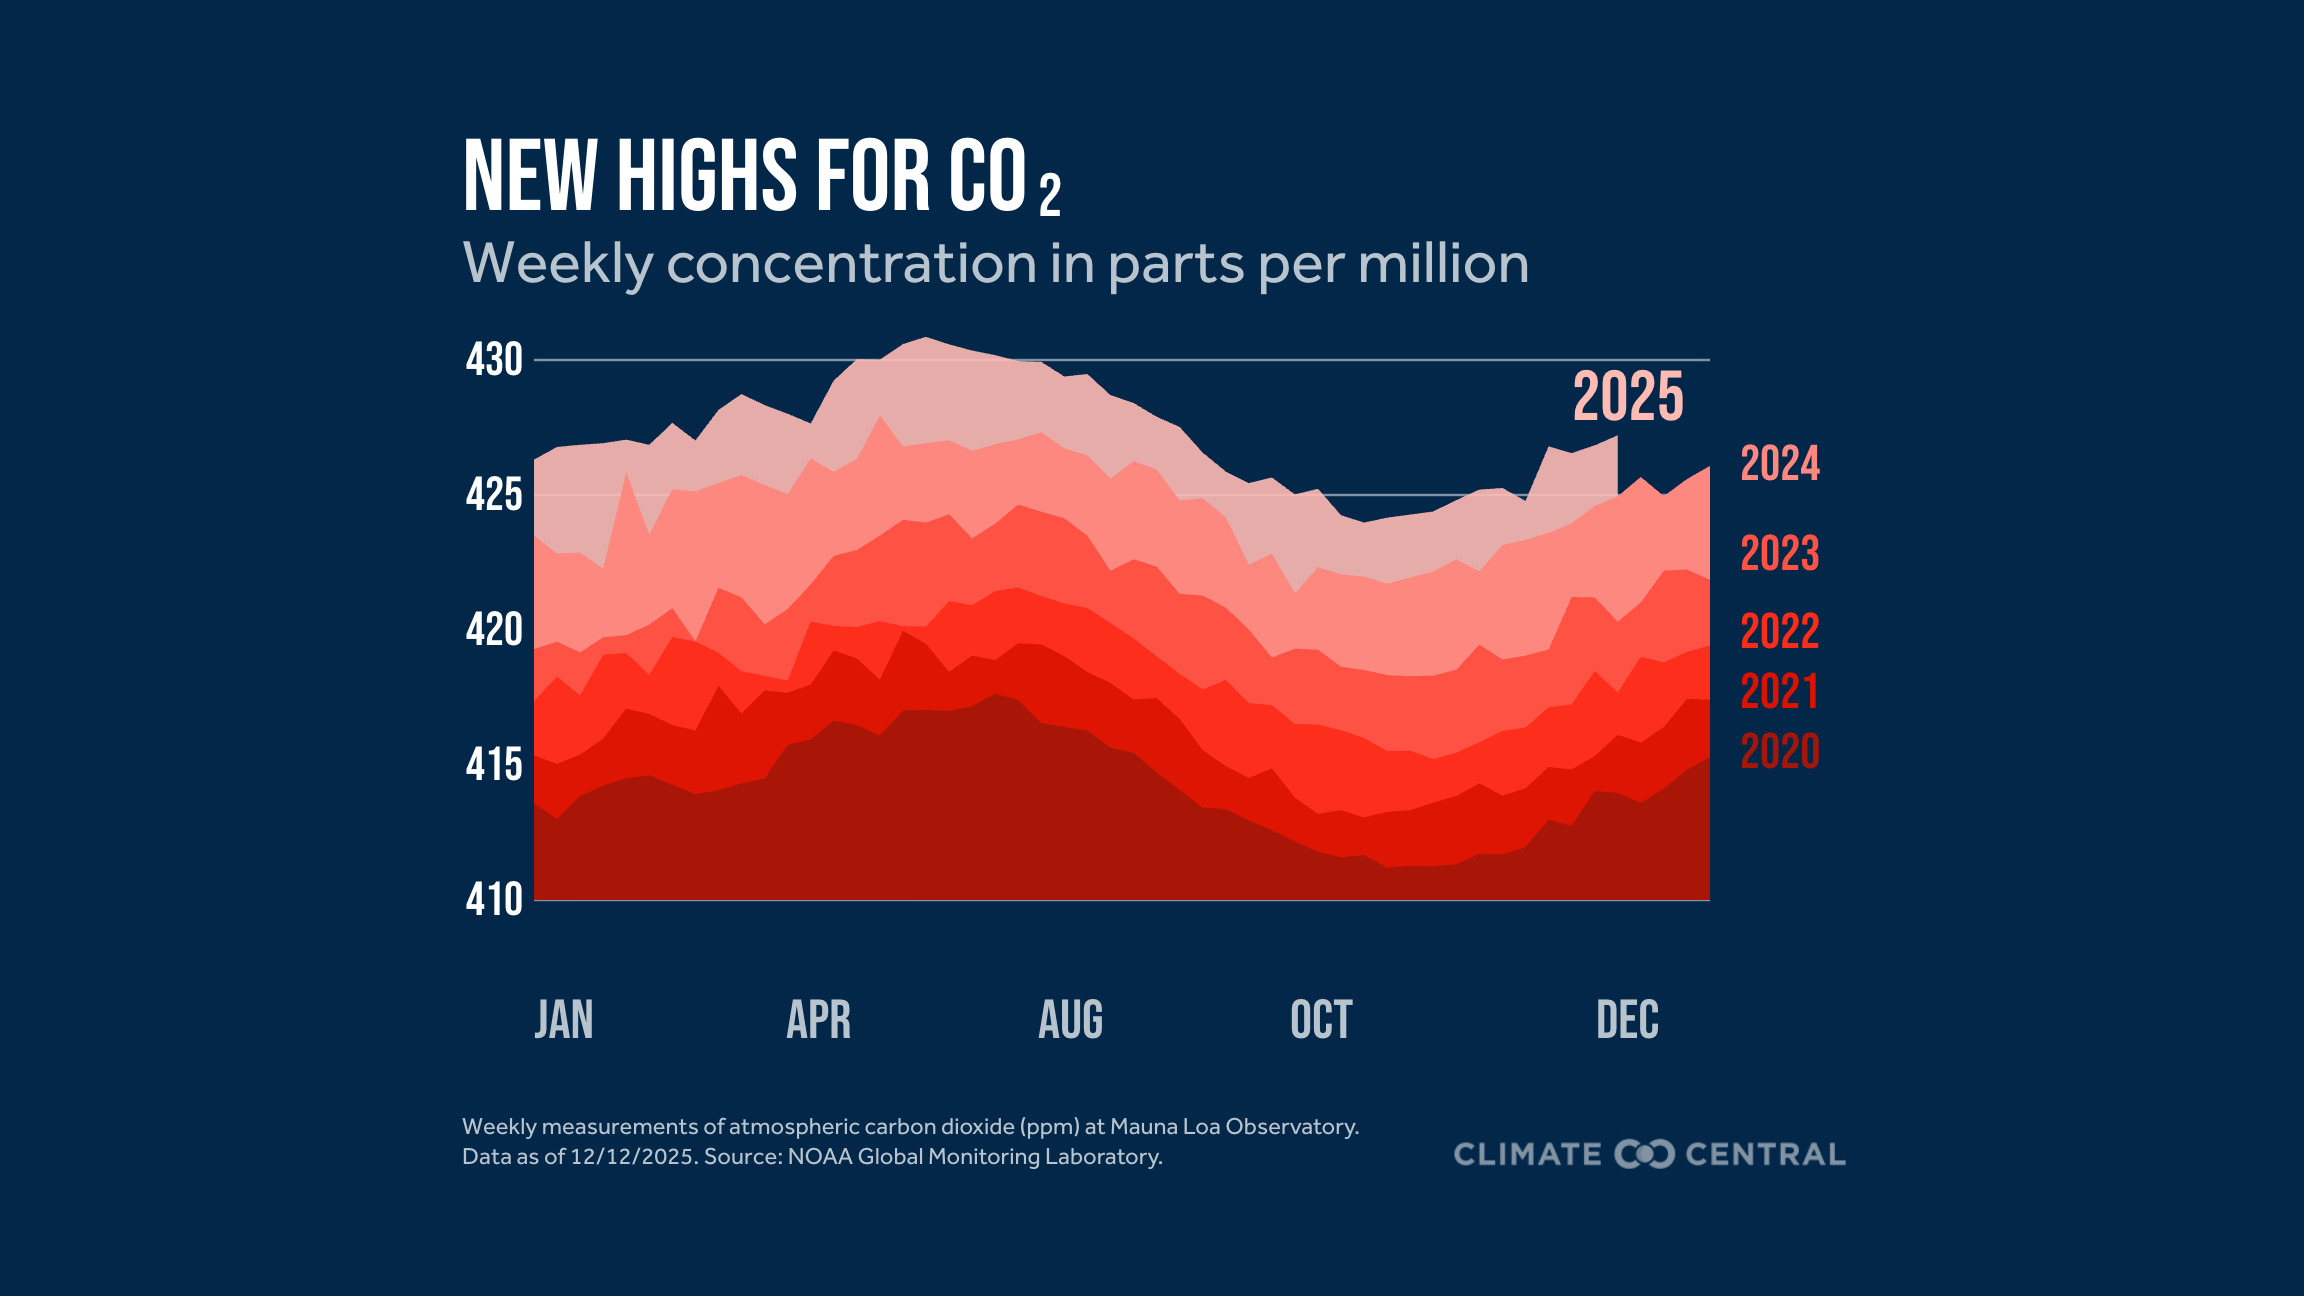
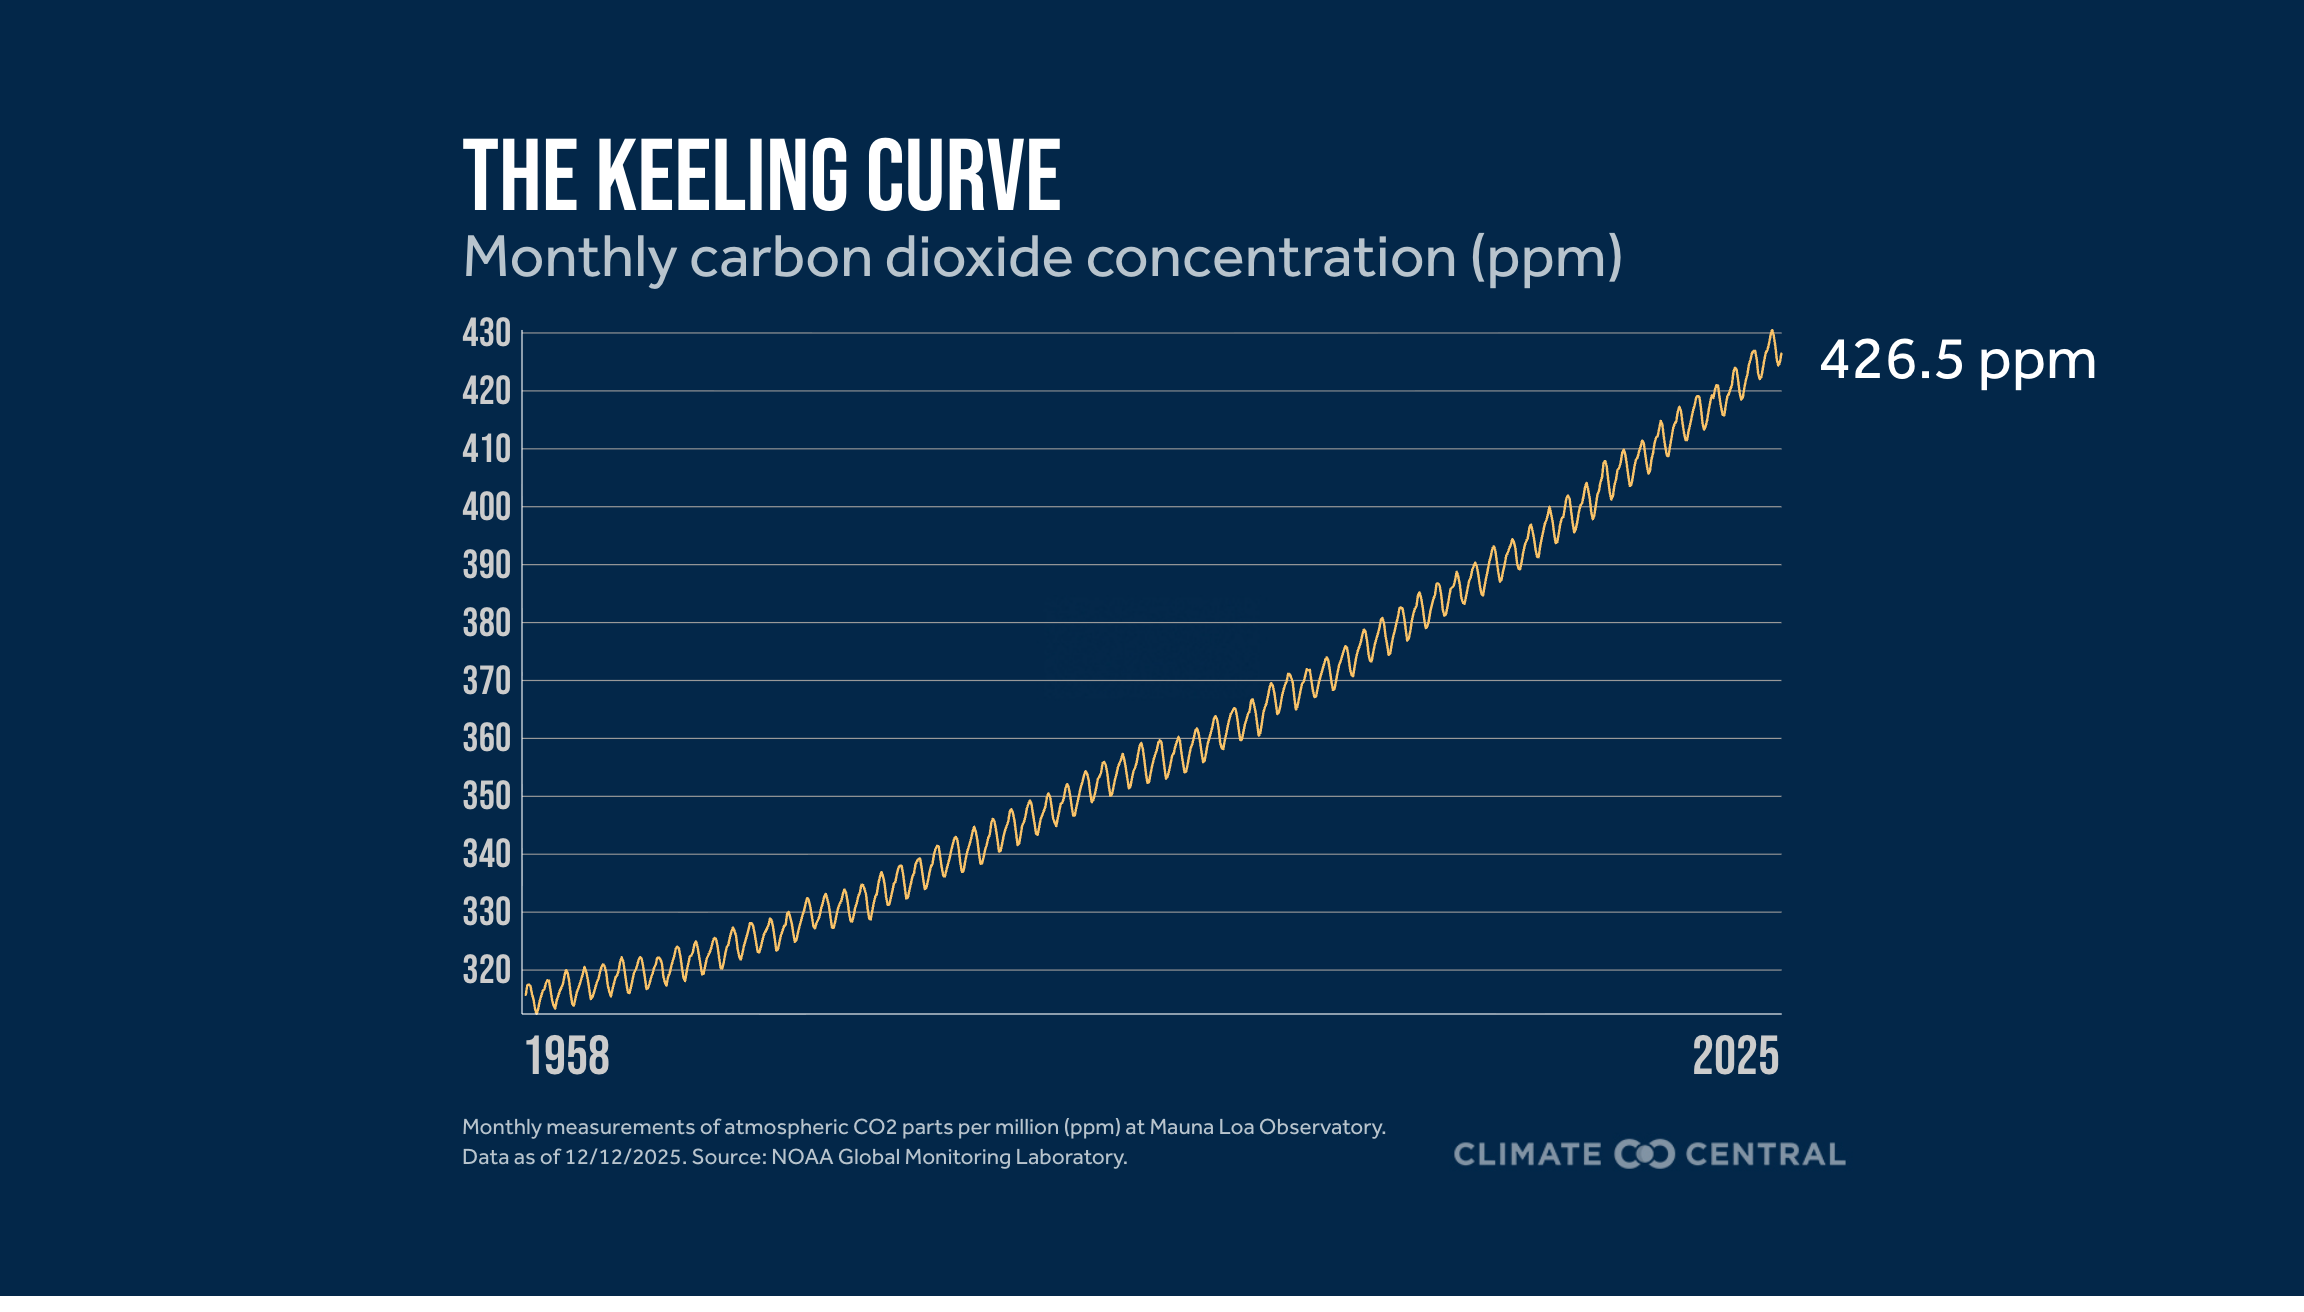
The average November carbon dioxide level measured at Mauna Loa, Hawaii was 426.5 ppm.
Arctic sea-ice extent ranked as the second lowest on record for November.
Antarctic sea-ice extent ranked as the fourth lowest on record for November.
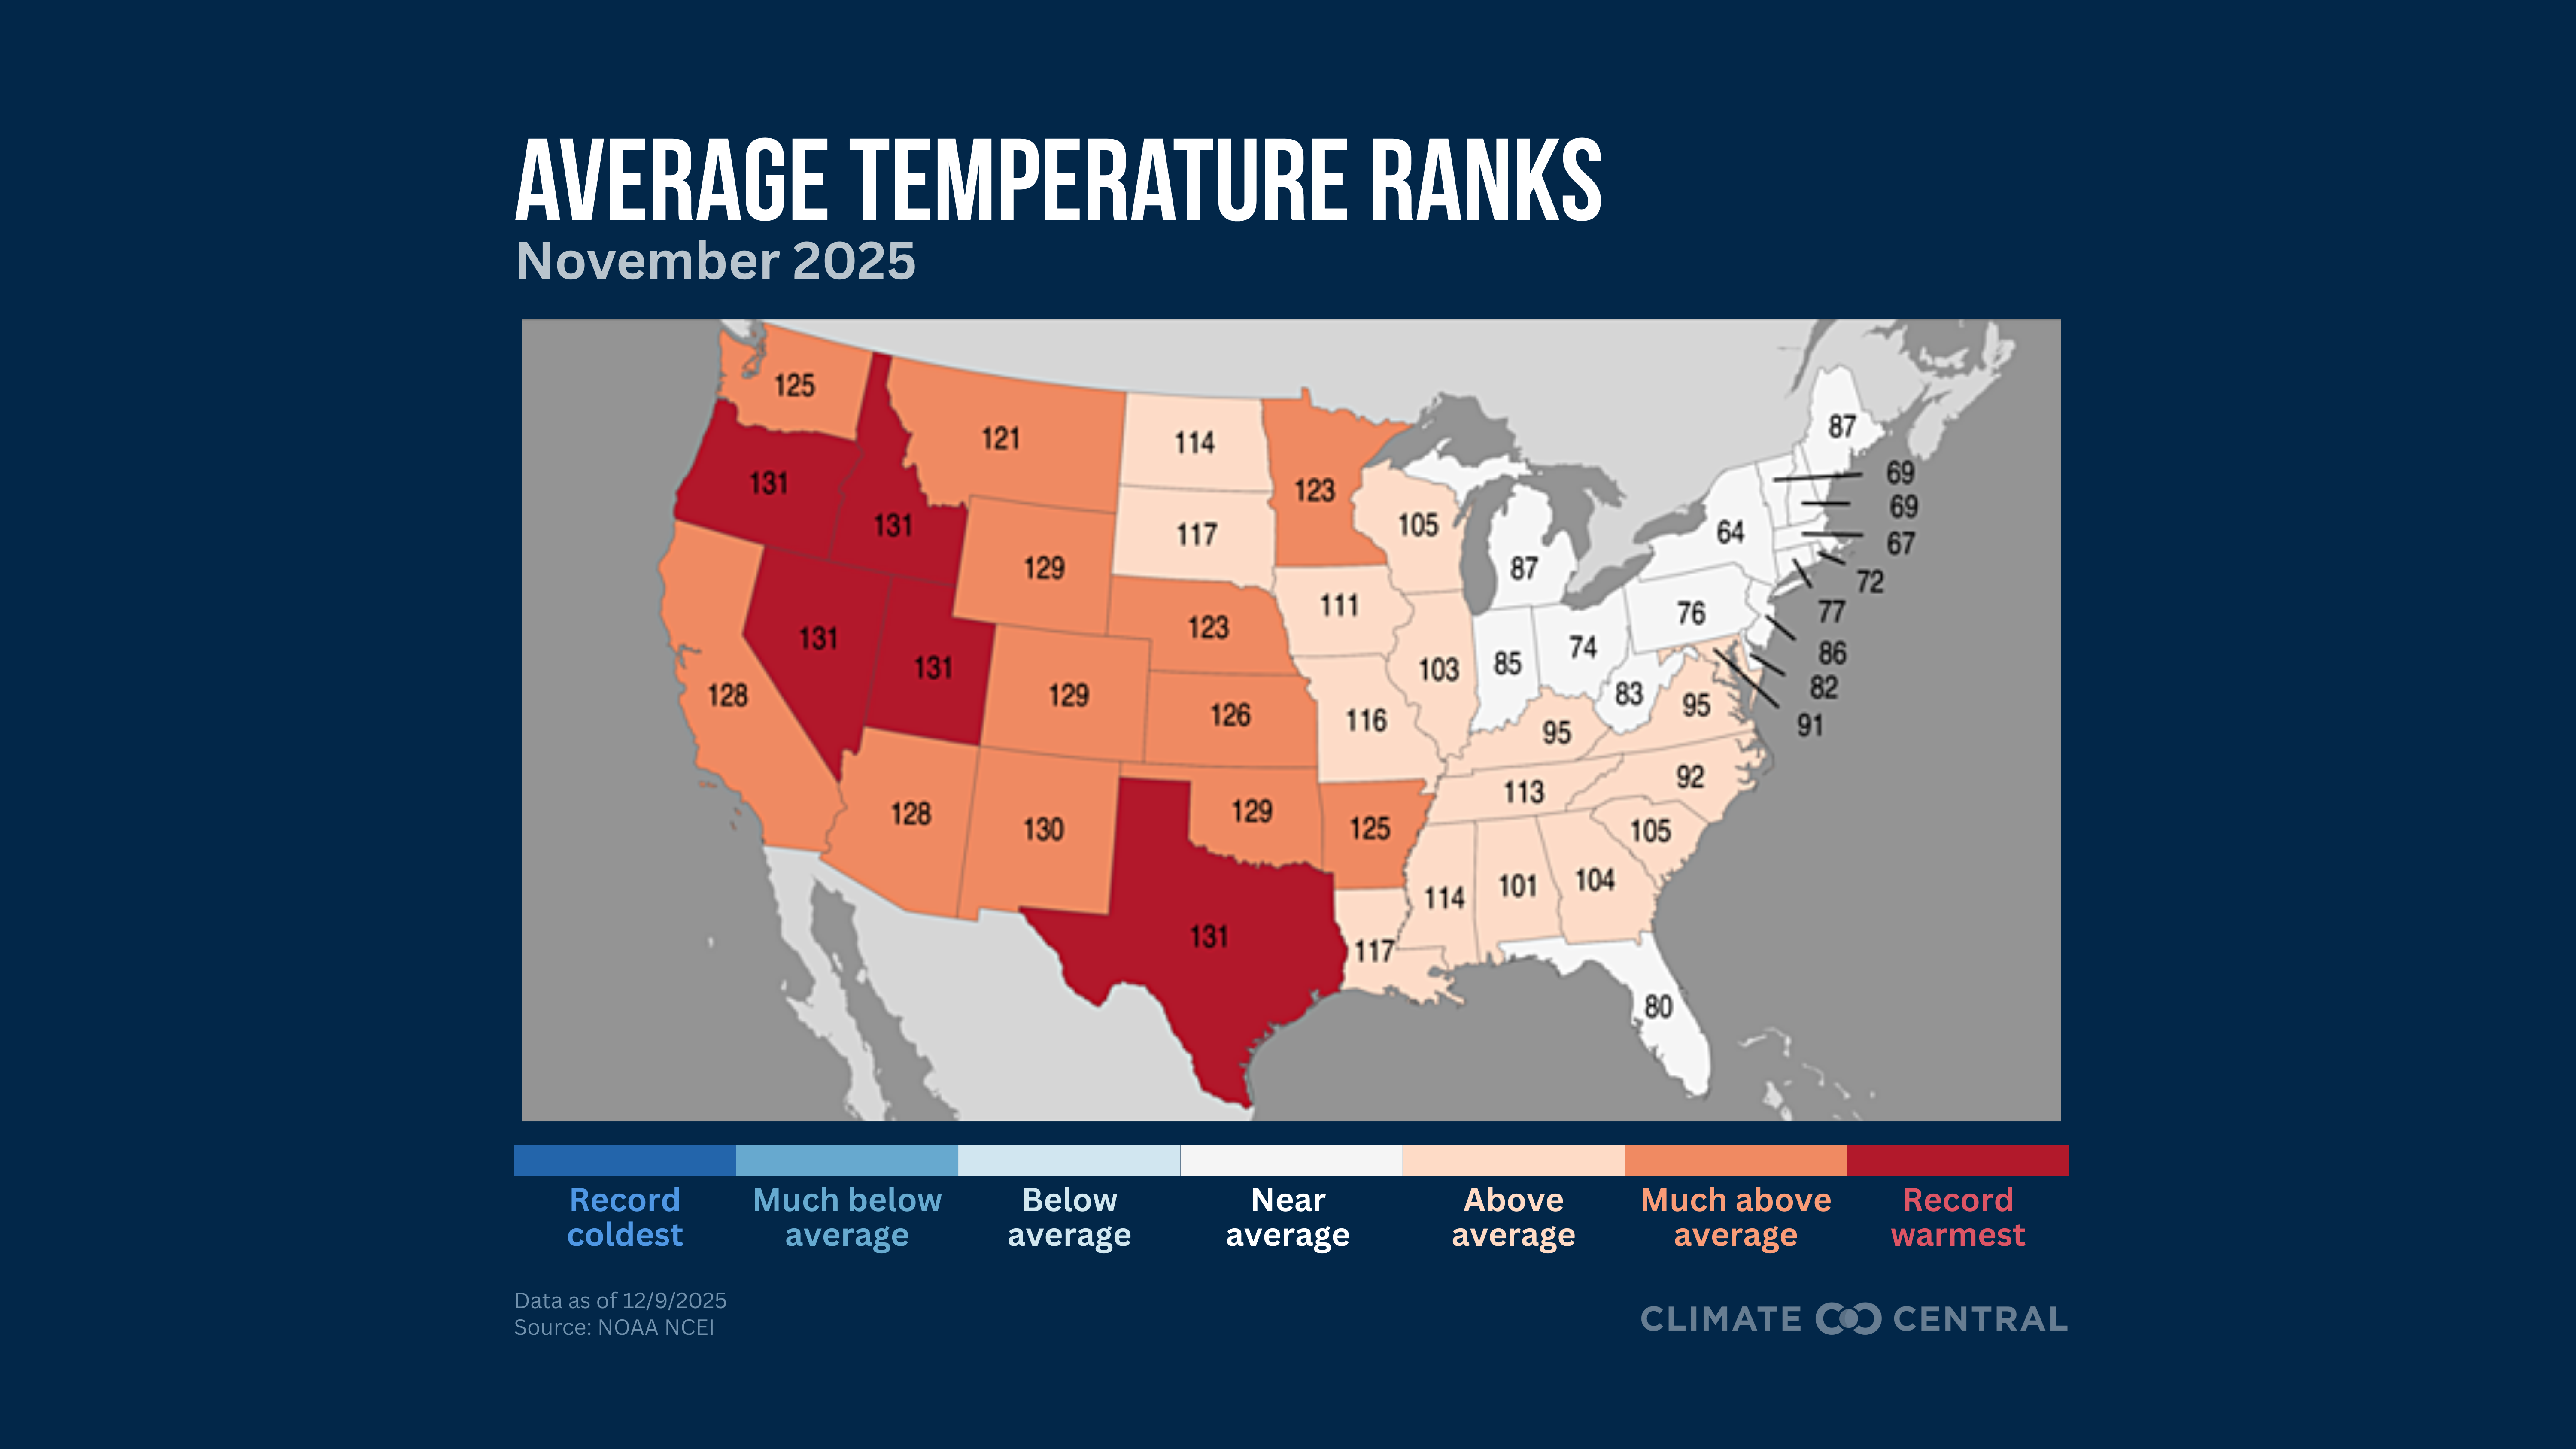
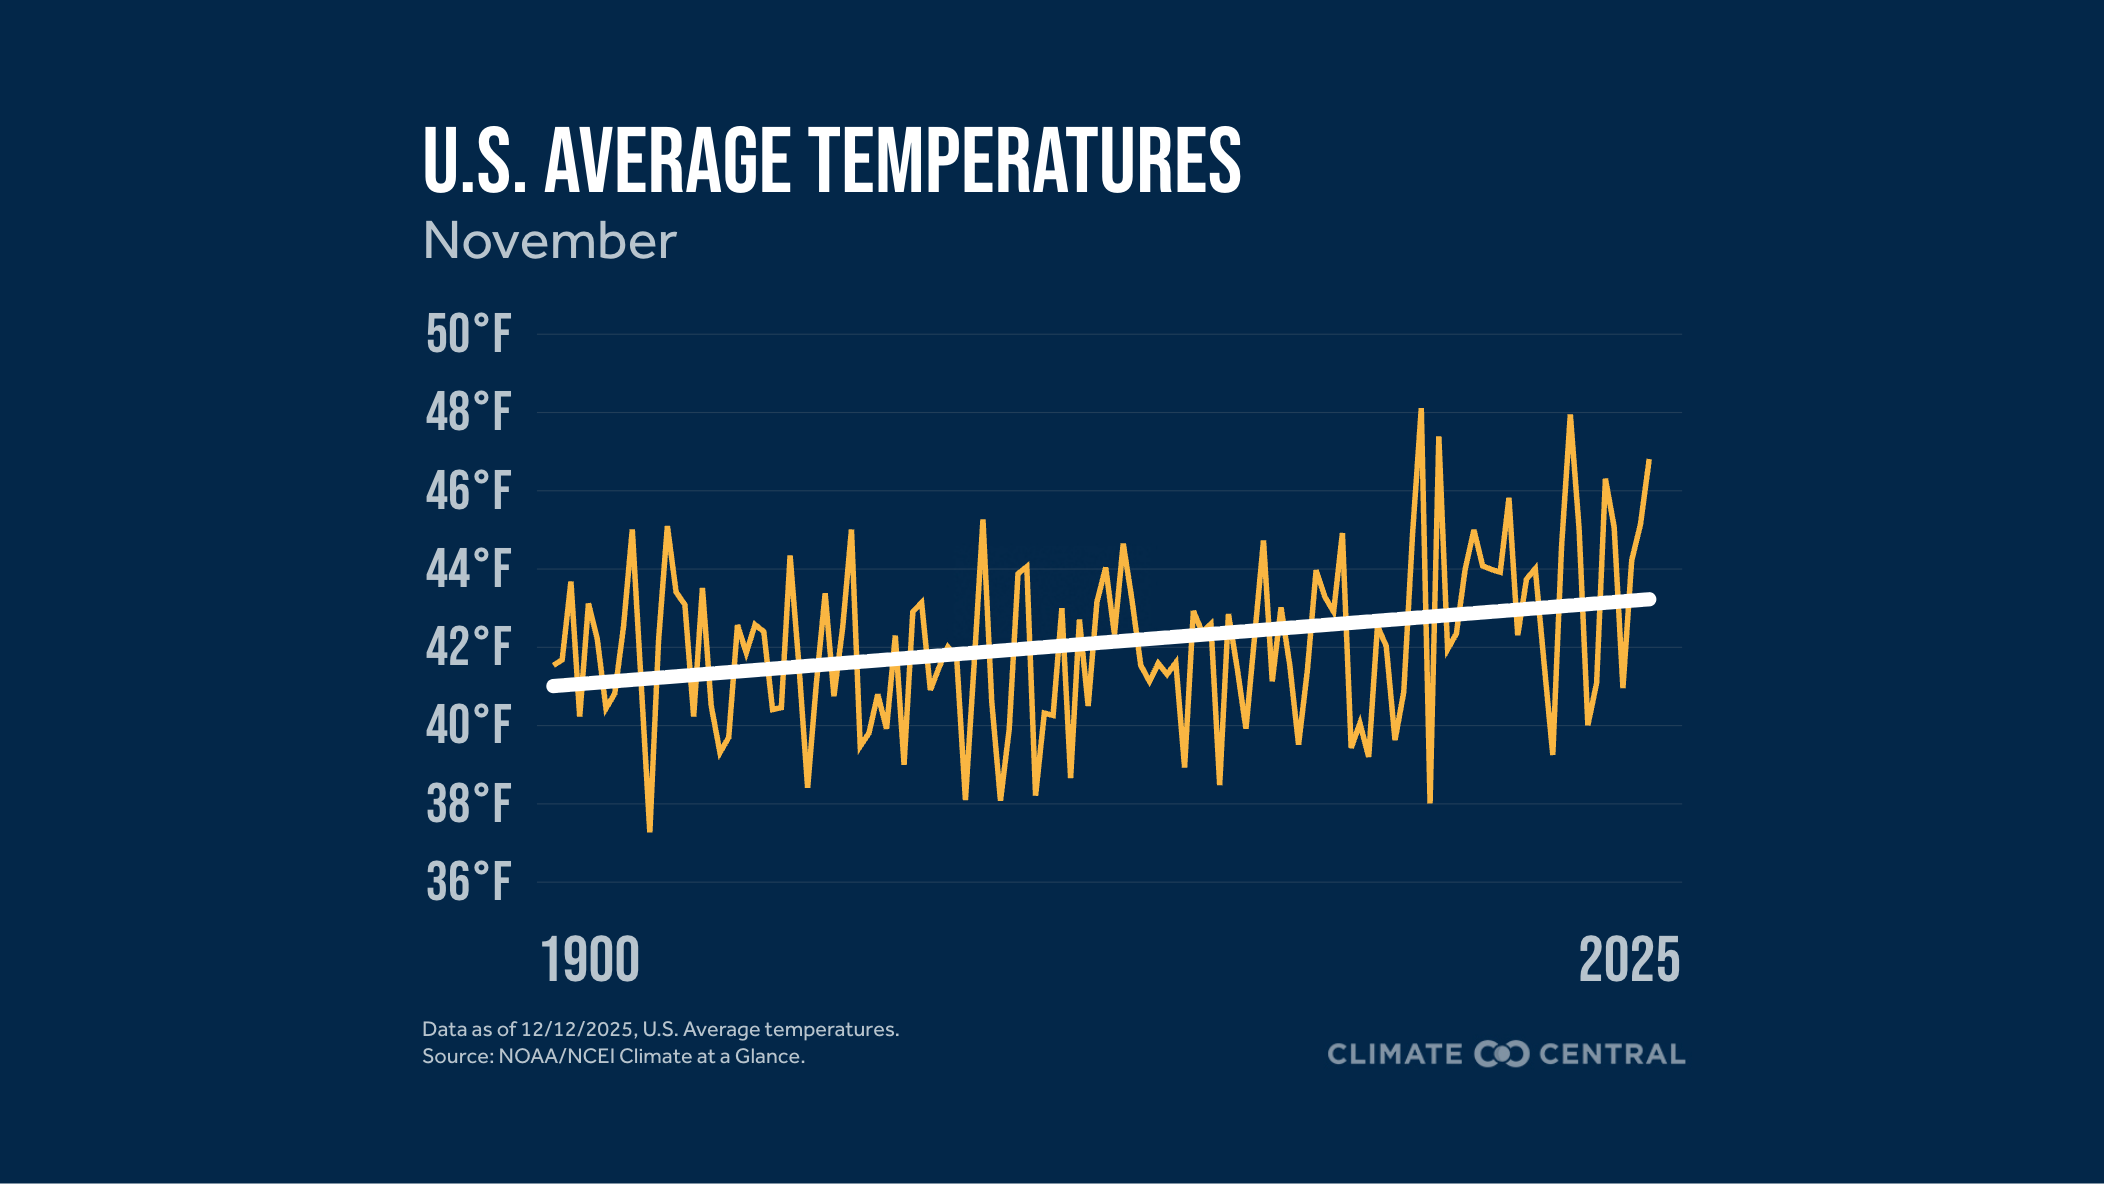
November 2025 ranked as the fourth-warmest November on record for the contiguous U.S.
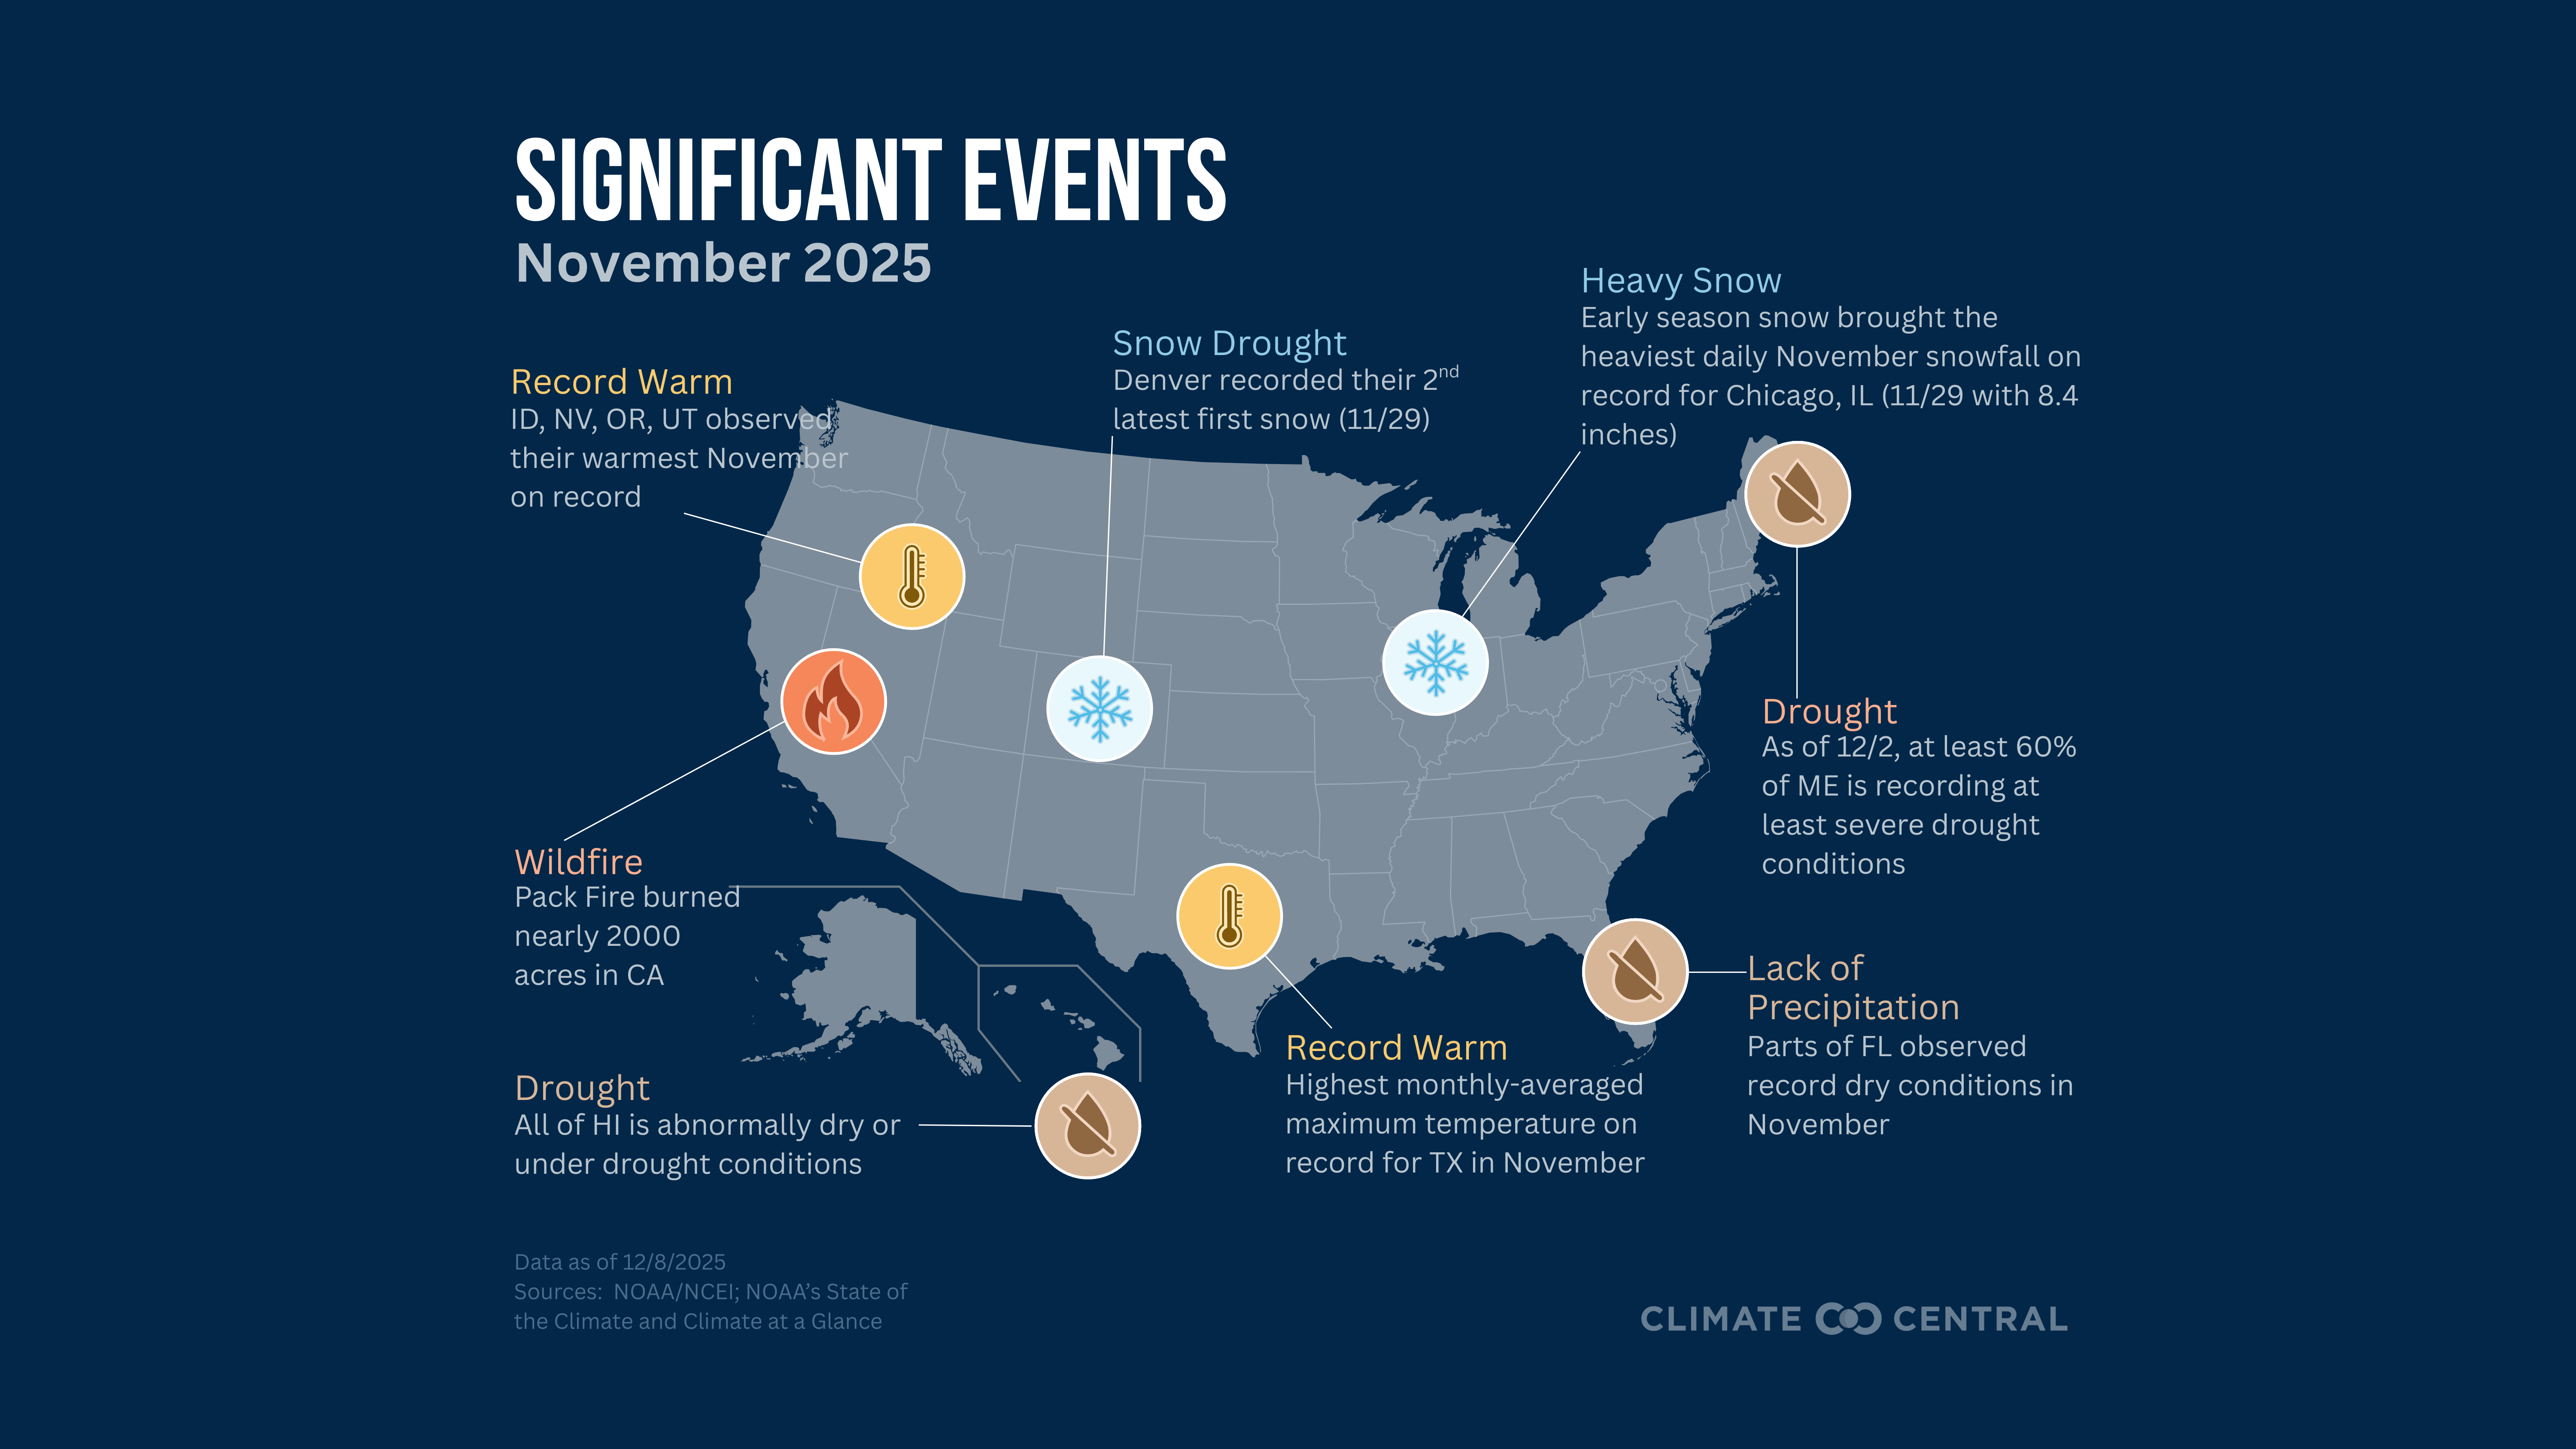
Idaho, Nevada, Oregon, Texas, and Utah observed their warmest Novembers on record.
The South climate region observed the warmest November on record.
The average minimum temperature over the last three months was the second warmest on record for the contiguous U.S. (September, October, November).
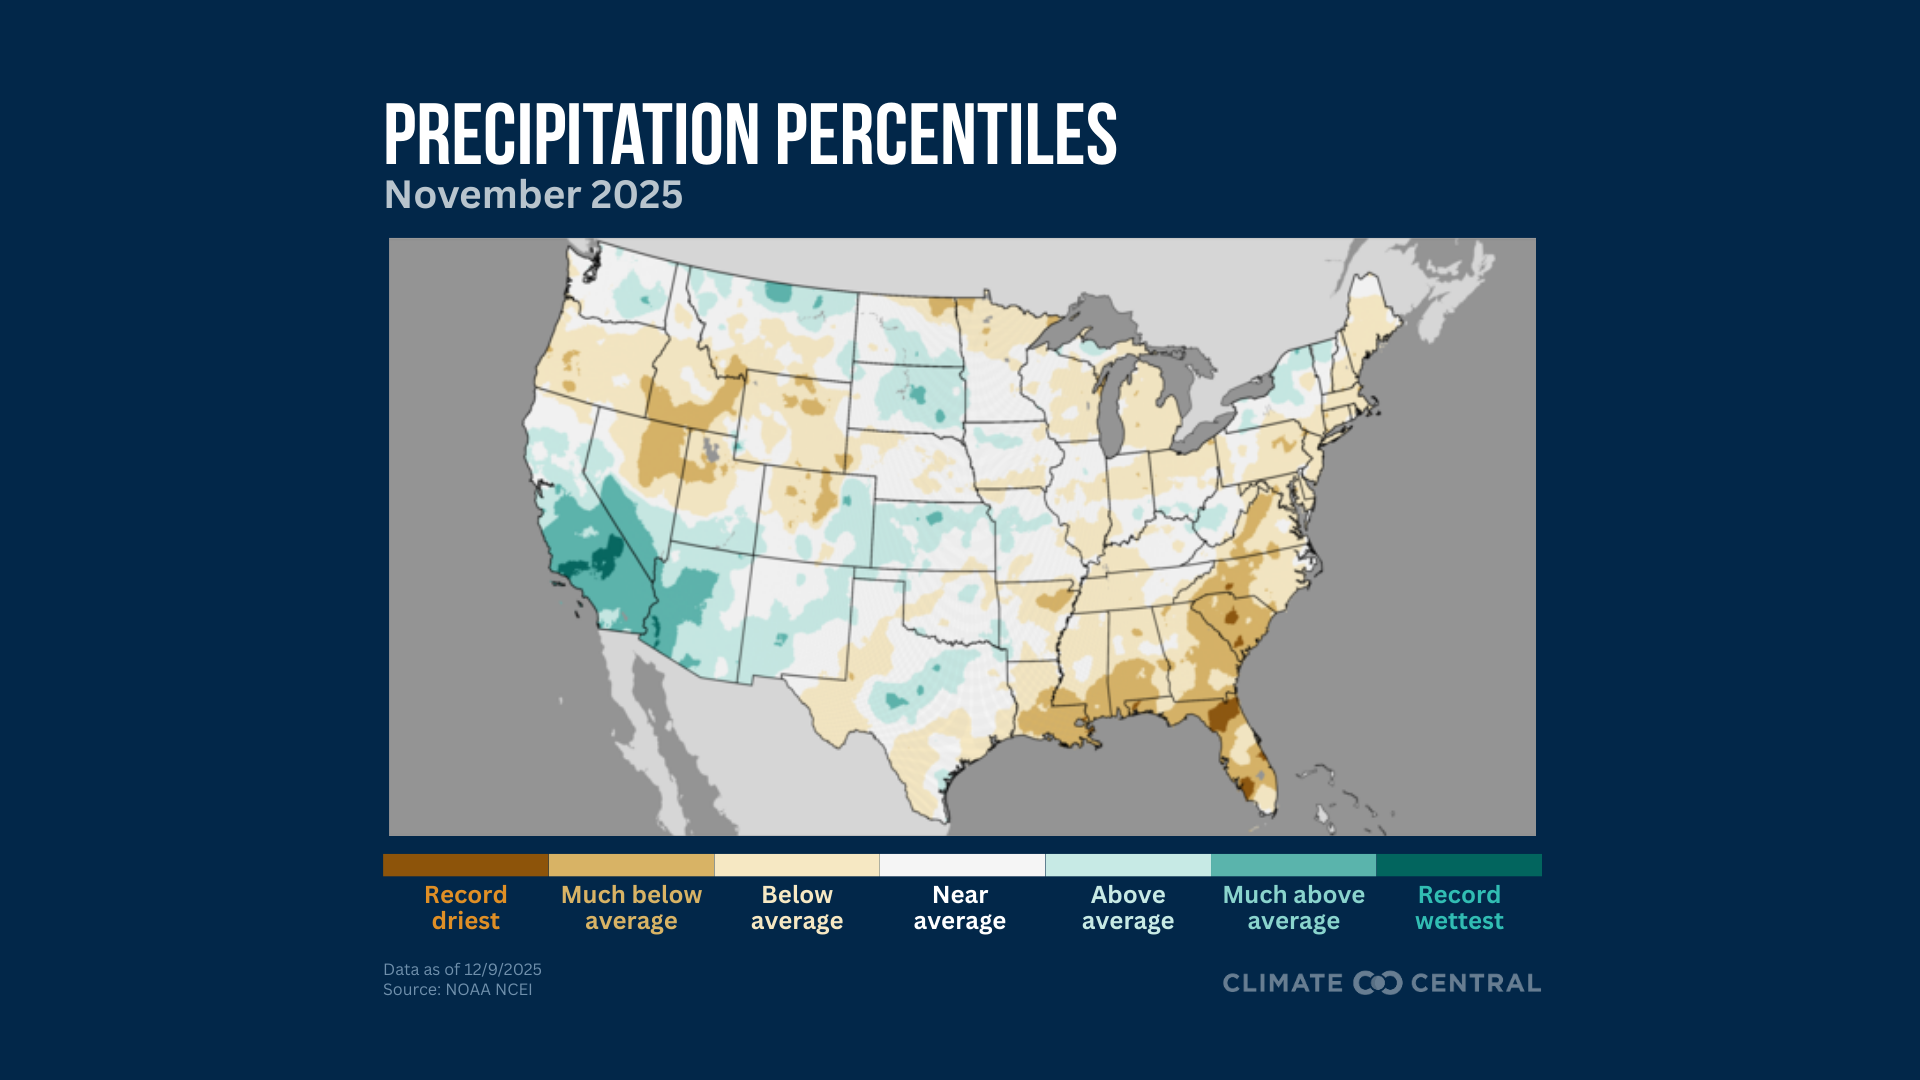
November 2025 ranked as the 26th-driest November on record for the contiguous U.S.
The Southeast observed the sixth-driest November on record.
As of Dec. 2, 2025, at least 67% of the contiguous U.S. is experiencing abnormally dry or drought conditions.
During the last few weeks of November, average temperatures were generally below normal across northern parts of the contiguous U.S., offering an early taste of winter ahead of the meteorological season that began Dec. 1. This chill was felt in major cities like Chicago, St. Louis, Minneapolis, Detroit, and Pittsburgh, where temperatures during the final week of November ran 2 to 5°F below normal, especially for daytime highs. Chicago observed its seventh snowiest November on record, with 10.4 inches of snow.
Even in a warming world driven by human-caused climate change, natural variability in the atmosphere will occasionally deliver cold air outbreaks and heavy snow events. The difference now is scale and persistence. These cold spells are overall becoming less intense and shorter-lived. A recent analysis by Climate Central found that the coldest day of the year has warmed by about 7°F on average since 1970 across 242 U.S. locations.
Data from the records tracker tool also show that record-breaking cold extremes are becoming increasingly rare in the last several decades. Cold snaps are also shrinking in duration. A Climate Central analysis found that cold outbreaks have shortened by roughly six days on average across 244 U.S. cities from 1970 to 2023.
The lack of cold is already having impacts on fruit and nut crops, infrastructure, energy demand resources, winter sports and recreation, snowpack and water reservoir supplies, and ecological systems, including changes in tick activity and invasive species populations.
Notable temperature event: Compared to other local stations, Waco, Texas experienced the most anomalous warmth in November, with an average temperature reaching 7.5°F above normal. This is consistent with their long-term winter warming trend, with temperatures increasing 2.5°F since 1970. As of late November, Waco has experienced more than a month’s worth of days in 2025 with temperatures made at least twice as likely by climate change. This is according to Climate Central’s Climate Shift Index (CSI).
Notable precipitation event: A series of early-season atmospheric rivers brought unusually heavy rainfall to southern California in November. Several counties recorded more than 200%of their average November precipitation. Los Angeles observed its fifth-wettest November on record, dating back to 1944. This rainfall extended an already wet pattern, with parts of southeastern California and western Arizona experiencing their wettest fall (September–October–November) on record.
One of the strongest climate change signals identified by Climate Central’s CSI emerged in mid-November, when temperatures across west Texas, New Mexico, and Colorado were made at least five times more likely because of carbon pollution (CSI level 5). Temperatures were more than 10°F above normal across most of the contiguous U.S. during this period, except for the Northeast region.
When averaged over the full month, the climate change signal was more pronounced in overnight low temperatures across the Rockies and Pacific Northwest, while the signal in daytime high temperatures was more evident across Texas.
Fifteen out of 192 cities analyzed across the contiguous U.S. experienced at least one week’s worth of days with temperatures made at least twice as likely by human-caused climate change (CSI 2).
Cities in the Southwest experienced the largest number of days in November with temperatures made at least twice as likely by human-caused climate change (CSI 2).
Learn more about how climate change altered November’s temperatures in our latest monthly attribution overview. Climate Central also has a new explainer on attribution science and how it works.
November is warming across the U.S. Of the 245 cities analyzed, about 92% (225) have experienced rising temperatures since 1970.
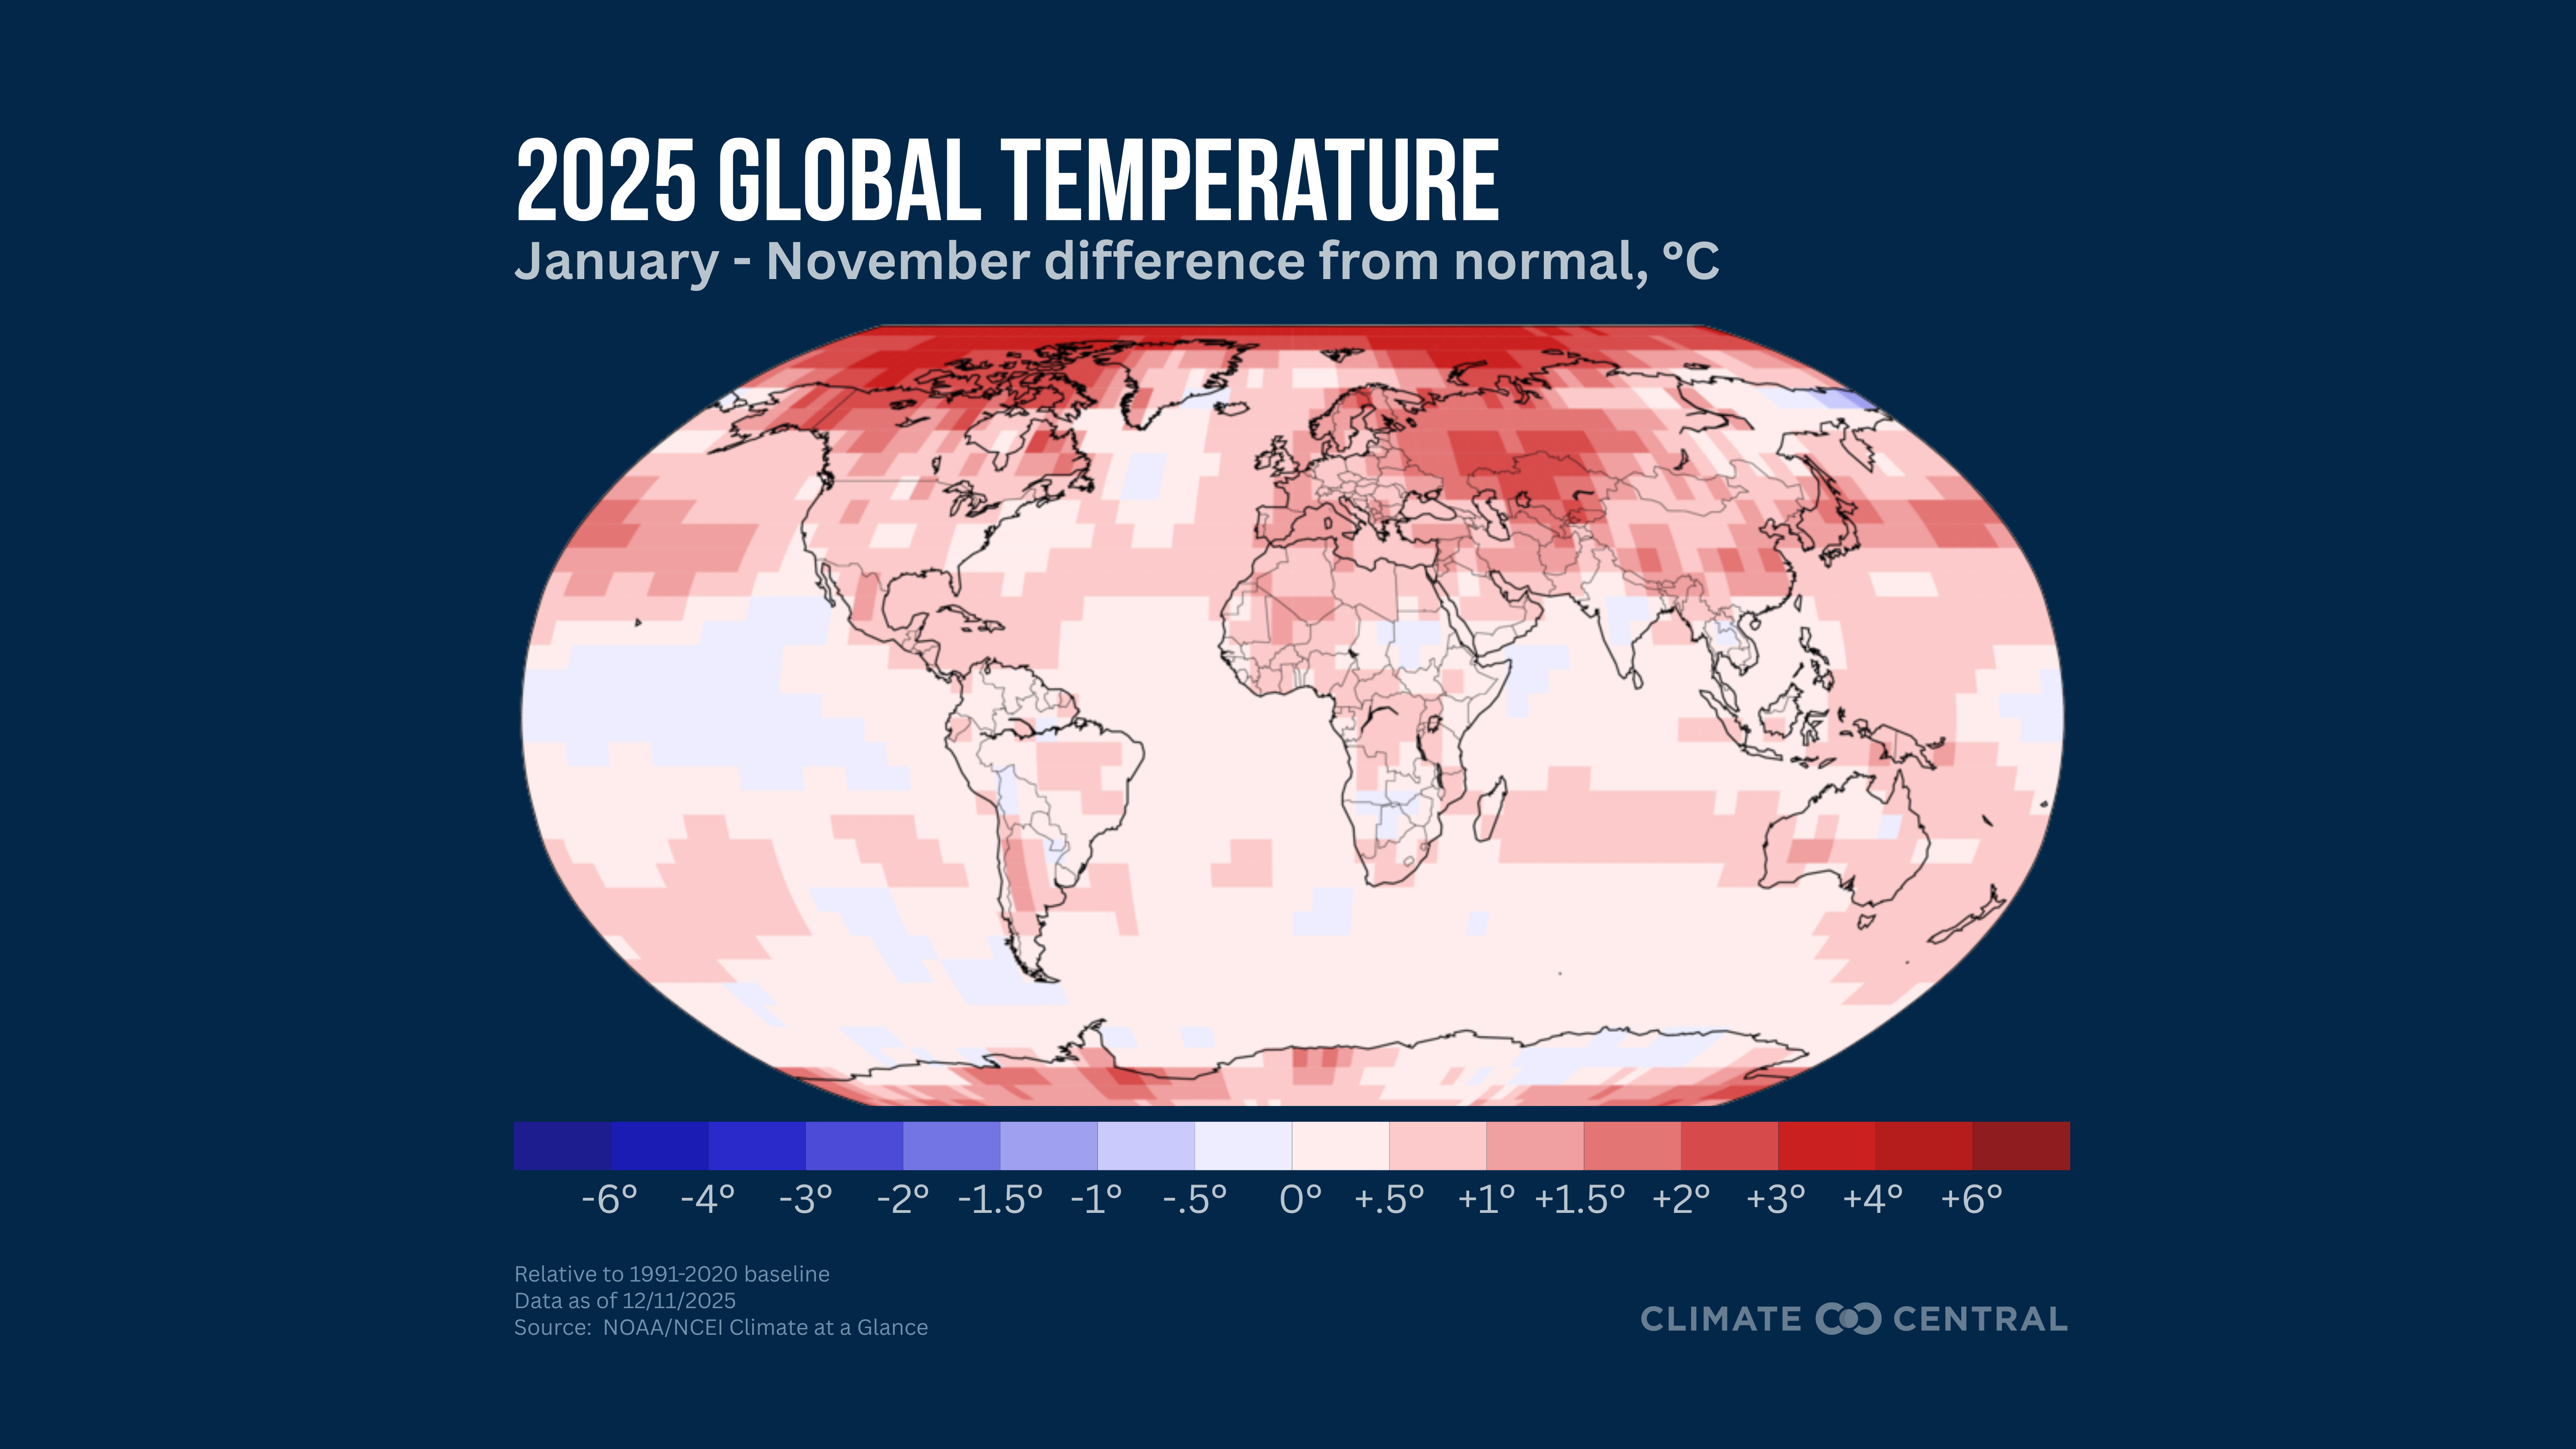
Global climate: Global temperatures are expected to remain far above normal through the end of the year, making it likely that 2025 will finish as one of the three warmest years on record (with records kept since at least 1850) and likely earlier. Forecasts from the North American Multi-Model Ensemble show a higher likelihood for above-normal land temperatures across most areas globally, except across parts of western and central Canada and Alaska. This pattern over the Northern Hemisphere is similar to that expected from a La Niña.
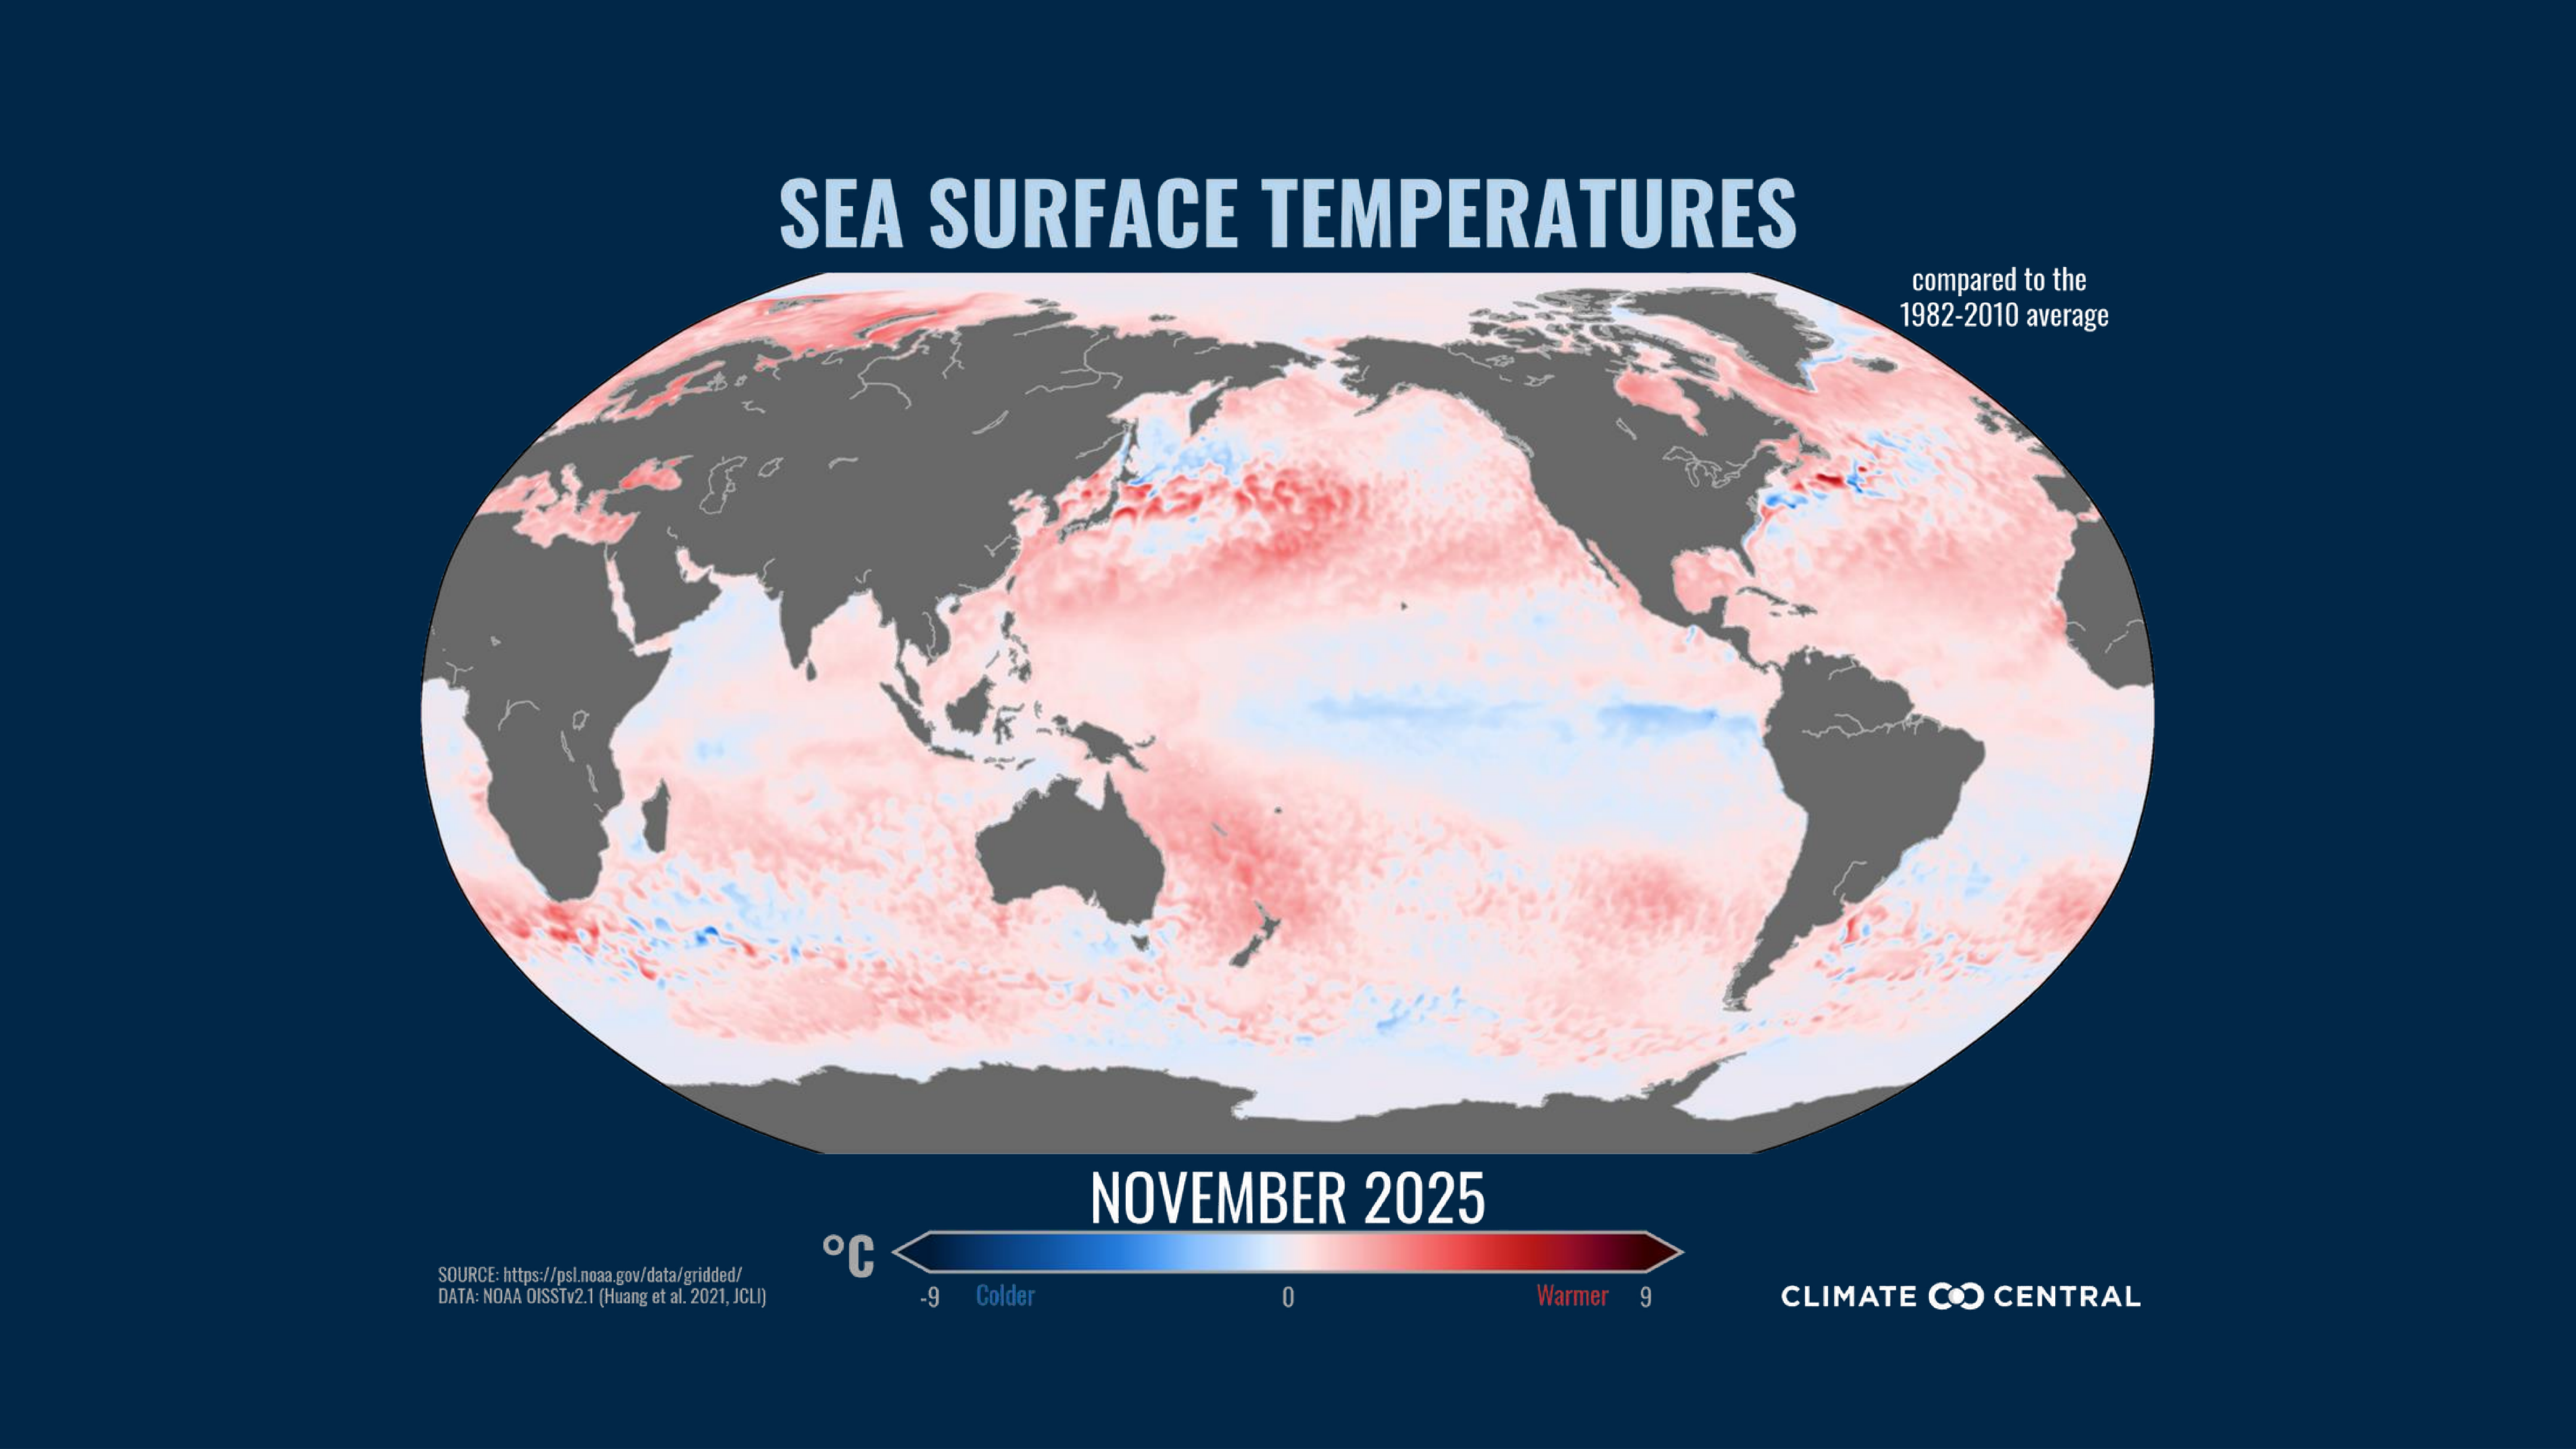
El Niño-Southern Oscillation (ENSO): A La Niña advisory continues, as issued by the NOAA Climate Prediction Center, with cooler-than-normal sea surface temperatures continuing across the central and east-central areas of the tropical Pacific Ocean. In fact, below-normal sea surface temperatures are currently observed across all regions used to monitor ENSO. These cooler conditions are expected to persist into early 2026, followed by a likely transition to a neutral ENSO state by March. Looking further ahead, some seasonal forecast models are beginning to hint at the possibility of a weak El Niño by next summer, though forecast skill at that lead time remains low and uncertainty is high. In the shorter-term, while every La Niña is different, they frequently bring an active jet stream dipping down from the Pacific Northwest to the Ohio Valley and an increase in storminess to some of these northern states. Research also suggests that weaker La Niña events are associated with more snow across these areas, including portions of the northern Northeast. However, when the strength of ENSO is weaker, seasonal climate patterns are less likely to show the usual El Niño- or La Niña-related impacts and the overall prediction skill can be lower.
Drought: As of early December, more than 43% of the contiguous U.S. is in at least moderate drought conditions and about 3%of that region is seeing extreme or exceptional drought. Streamflow gauges monitored by the USGS continue to show well-below-normal levels in states such as Maryland, Massachusetts, New Jersey, and Pennsylvania. In contrast, stream flow is much above normal or high across the Pacific Northwest, where more heavy precipitation is also forecast. Drought improvement is forecast across states such as Idaho, Montana, and Washington as well as along the Gulf Coast through December.
Temperature: A building upper-level ridge of high pressure across the western U.S. will lead to a higher chance of above-normal temperatures through the end of December, with the greatest probability across the Southwest region. Cooler-than-normal temperatures are most likely across the Great Lakes and Northeast early on, with those odds decreasing later in the month. Across Alaska, there is a greater chance of colder-than-normal temperatures, while in Hawaii there is a greater chance for warmer-than-normal conditions.
Precipitation: The latest NOAA Climate Prediction Center outlooks for the next two weeks show increased odds of wetter-than-normal conditions in the Pacific Northwest, while the Southwest is more likely to be drier than average. The risk of heavy precipitation is particularly high across western Oregon and Washington in mid-December. This overall precipitation outlook is similar to the expected impacts associated with La Niña conditions.
Energy: Unusually cold temperatures across the Midwest and extending into the Northeast will increase heating demand during the next several weeks, with the potential for above-normal heating degree days for the month of December. The risk is particularly high for major cities like Chicago and Minneapolis. However, conditions in these regions are forecast to moderate later in the month, with more widespread seasonal to warmer-than-normal temperatures emerging.
Our team of scientists can help you interpret these findings for actionable insights. Contact us here.
To request a media interview with a Climate Central scientist about this briefing, please contact Abbie Veitch, aveitch@climatecentral.org.
Global and U.S. climate statistics are provided by NOAA’s National Centers for Environmental Information (NCEI), including through the Climate at a Glance tool. All climate regions and divisions follow the standard definitions established by NOAA NCEI. Data is also provided by the Applied Climate Information System (ACIS), which is developed, maintained, and operated by NOAA’s Regional Climate Centers. We recognize that climate ranking statistics can vary slightly between datasets.
Drought information is available through the U.S. Drought Monitor. Weekly and seasonal temperature and precipitation outlooks are from the NOAA Climate Prediction Center. Sea ice data statistics are from the National Snow and Ice Data Center’s Sea Ice Index v4. Carbon dioxide concentration data is from the NOAA Global Monitoring Laboratory.
Learn more about Climate Services at Climate Central


_1900-2025_12_12_2025.png)