KEY CONCEPTS
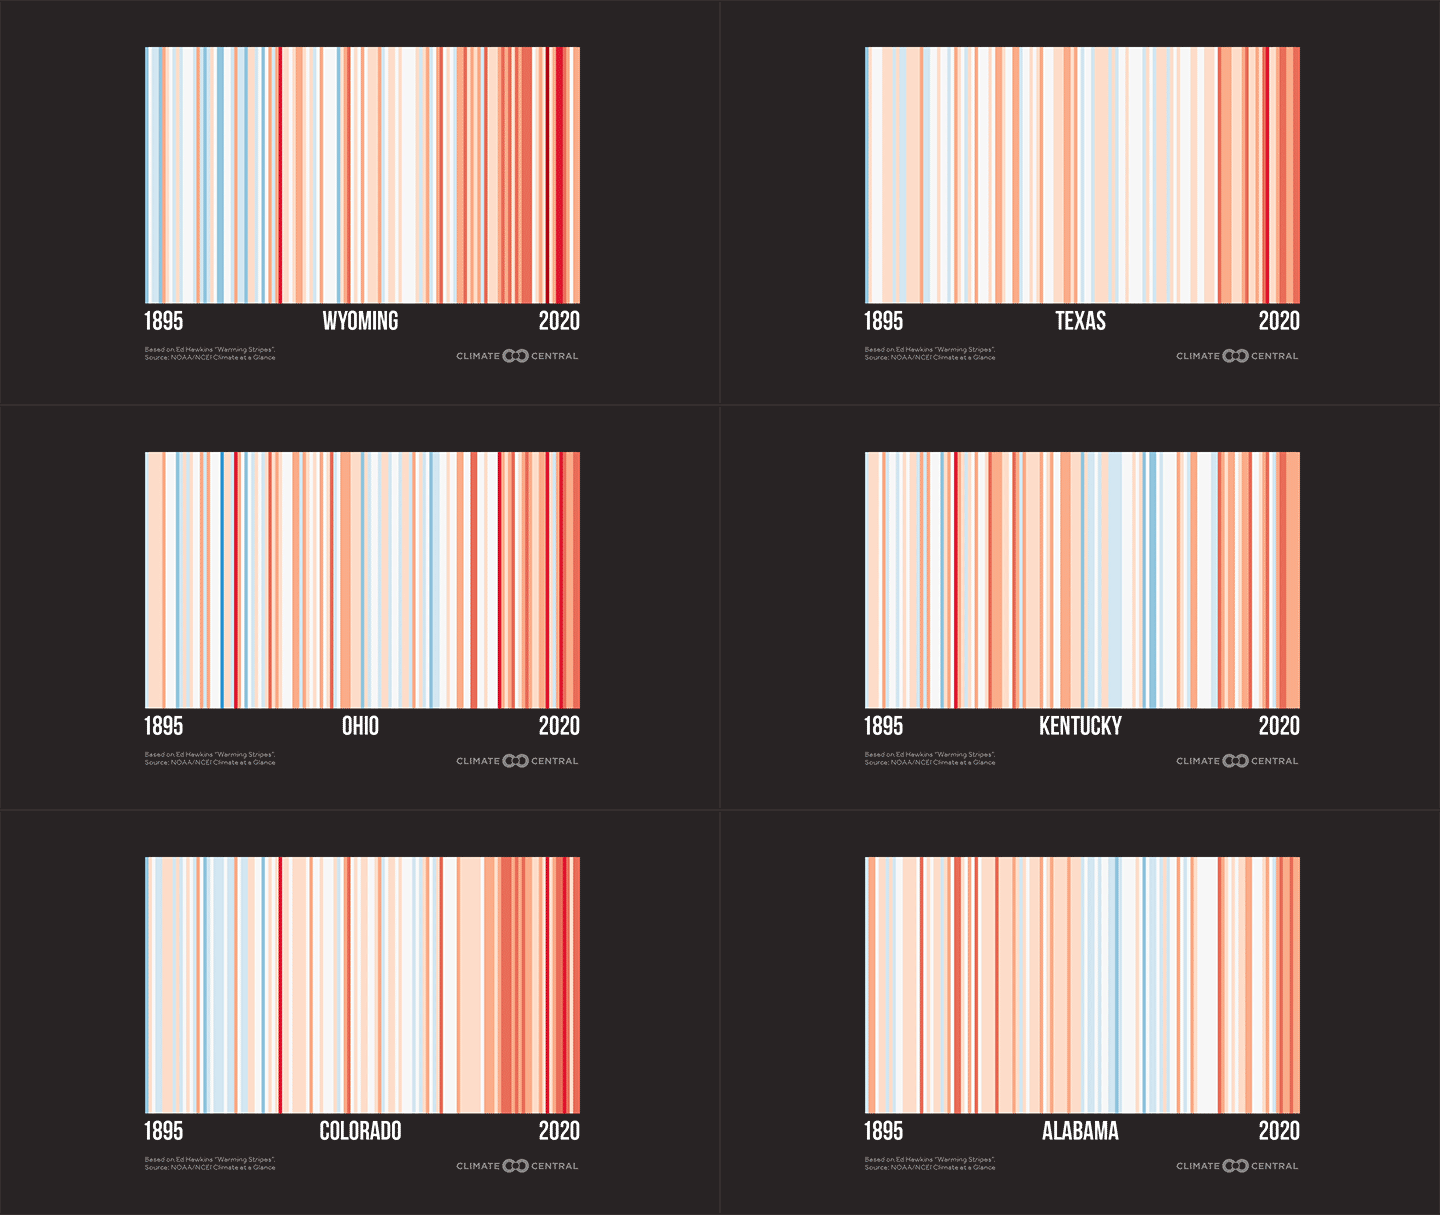
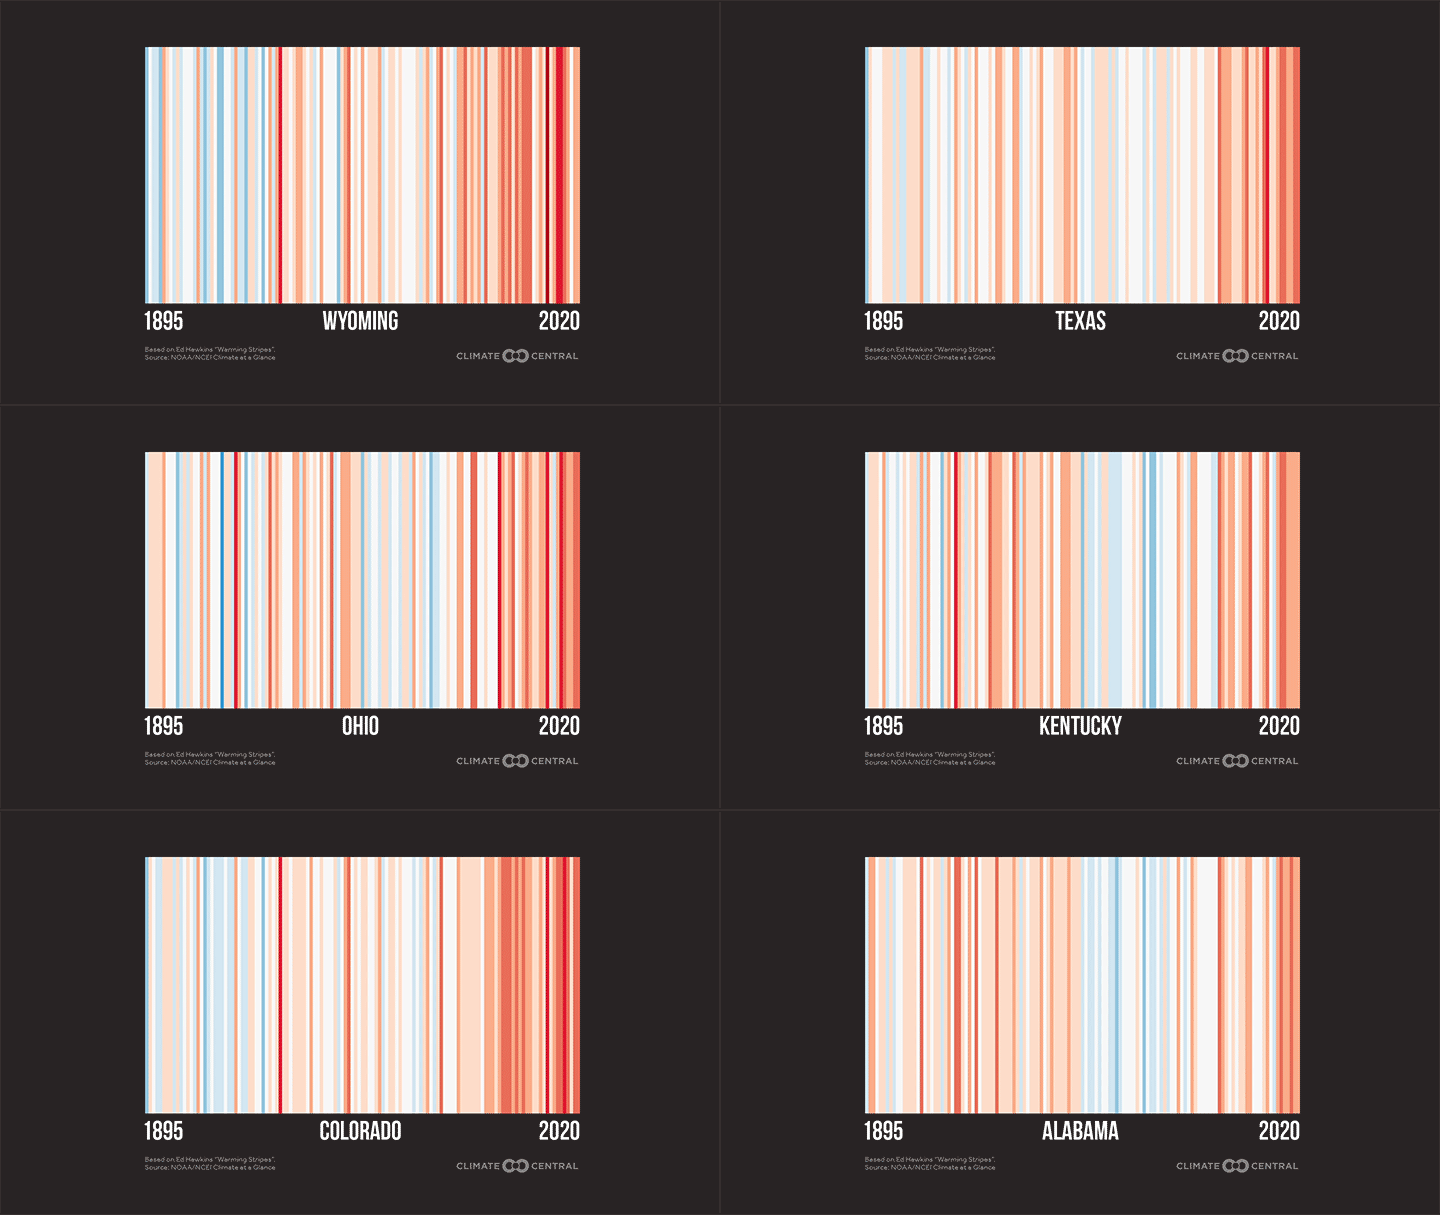
Monday (June 21st) is the fourth annual #ShowYourStripes. In celebration, Climate Central has updated the warming stripes graphics for the U.S. states and some of our cities.
#ShowYourStripes coincides with the start of summer—the season of the extremes. In the full release, you can find more information on the biggest summer extremes, like hurricanes, droughts, wildfires, and extreme heat.


Monday (June 21st) is the fourth annual #ShowYourStripes. It initially started as #MetsUnite, when meteorologists around the world came together to inform the public of the realities of climate change. Since then, it’s expanded to include all people who want to raise awareness.
The Warming Stripes: Created by climate scientist Ed Hawkins, the warming stripes have become an iconic symbol worldwide.
The stripes use annual temperature anomalies to create a simple “striped” visual. Red stripes are years above a long-term average temperature and blue stripes are years below.
Climate Central has updated these “stripes” graphics for the U.S. states and some of our cities (those with 100+ years of data)—adding a stripe for 2020, one of the hottest years on record, globally.
POTENTIAL LOCAL STORY ANGLES
The Season of the Biggest Extremes: #ShowYourStripes kicks off at the start of summer, also known as the season of the biggest extremes. As temperatures rise due to climate change, the added heat contributes to stronger hurricanes, larger wildfires, worsening droughts, and more extreme heat.
For #ShowYourStripes, consider local story angles about the most relevant extremes in your area. Below is a table of recent Climate Matters bulletins (which include story angles and local and national experts) on each topic.
Stay tuned for next week’s Climate Matters which will dive deeper into climate extremes!
Hurricanes
Drought and Wildfires
Extreme Heat


Humid Heat Extremes on the Rise
For more content on extremes, visit our media library here
Realtime Climate: Hear from Ed Hawkins and a panel of climate reporters on #ShowYourStripes Monday when Climate Central hosts a webinar to officially launch Realtime Climate. It’s the new resource that provides you with timely, personalized alerts when climate connections can be made to unusual weather events or newsworthy happenings in your community.
As a Climate Matters subscriber, you are automatically enrolled in Realtime Climate and may have received alerts during our development of the automated system.
We encourage you to share this subscription link with your colleagues who may be interested in receiving their own Realtime Climate alerts.
Register for the January 21, noon ET webinar here.
Realtime Climate FAQ's
METHODOLOGY
The “warming stripes” design was conceived by Ed Hawkins, as described here. Stripes for stations and states are based on the anomaly from the 20th century average. For a subset of locations where there was no data until after 1901, the anomaly is based on the oldest 100-year average available for that city. Stations with less than 100 years of data were not included. Station data is from Applied Climate Information and state data is from NCEI Climate at a Glance.
