Climate Matters•April 12, 2023
Severe Storm, Supercell, and Tornado Trends
KEY CONCEPTS
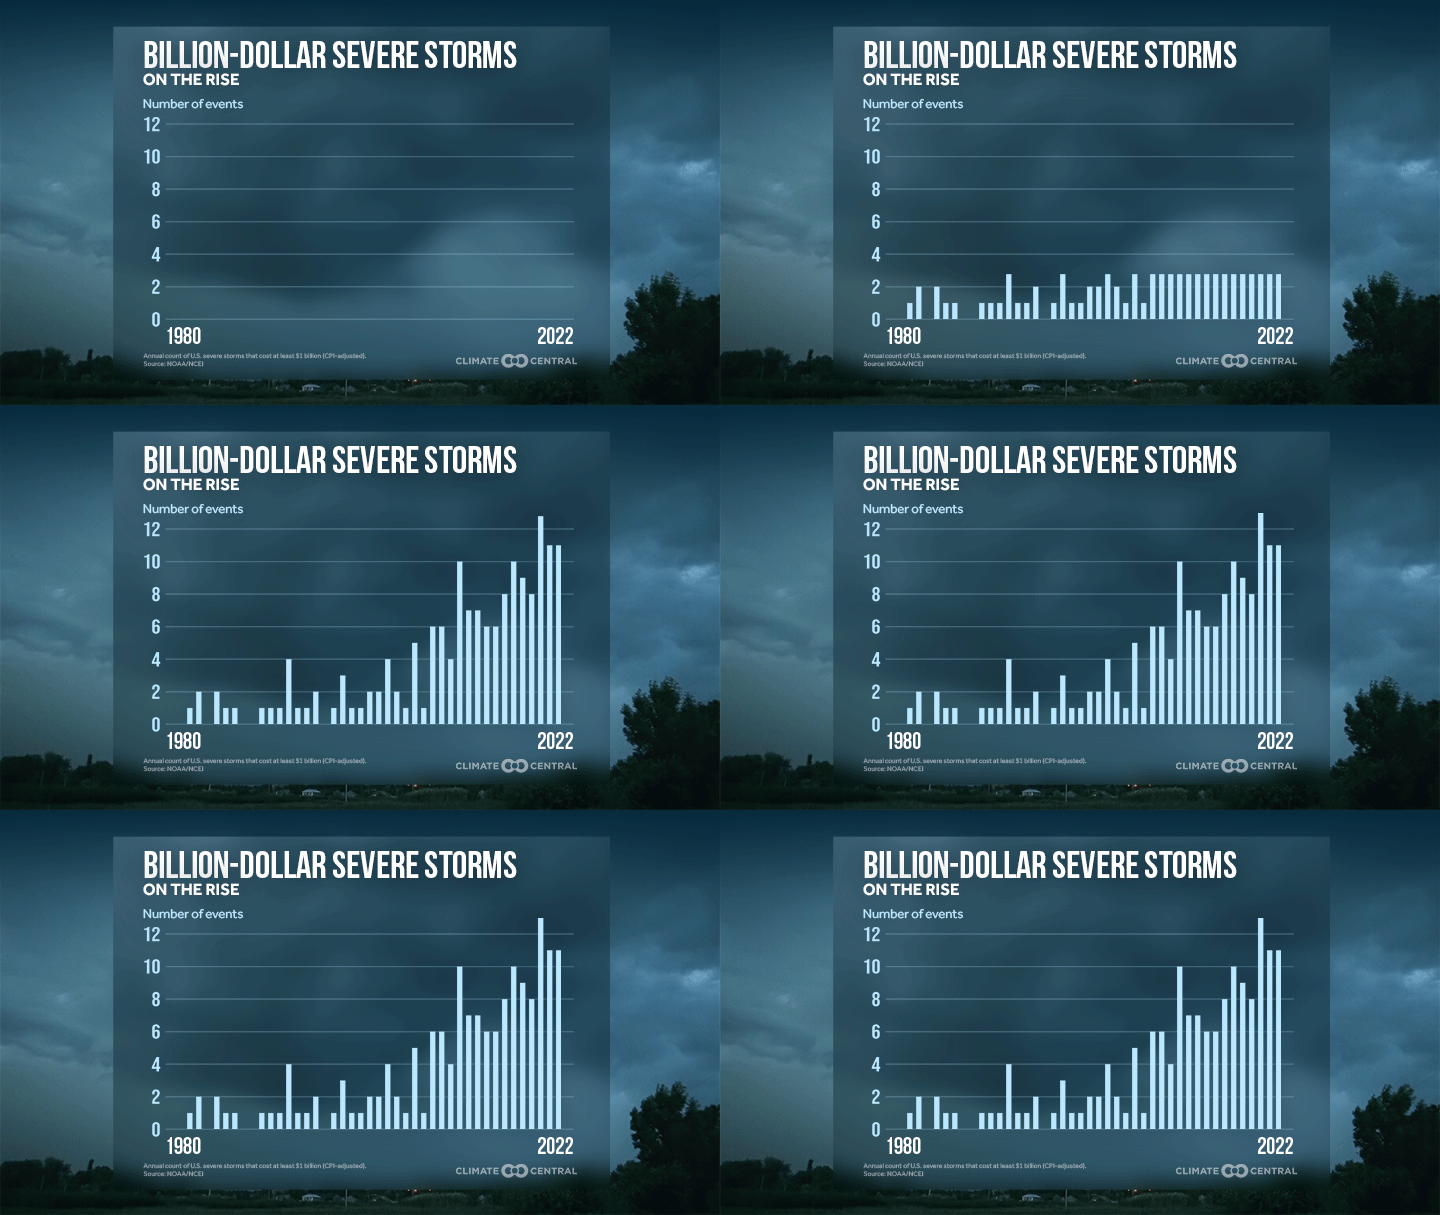
Severe storms account for nearly half of all U.S. billion-dollar weather disasters since 1980.
The U.S. experienced six times more billion-dollar severe storms during 2001–2022 than during the previous two decades.
As the climate continues to warm, the number of days conducive to severe weather is projected to increase.
The threat of supercells—severe, rotating thunderstorms—is dramatically increasing in parts of the country, including areas unaccustomed to these dangerous storms.
Conditions favorable to supercells and tornadoes are expanding into historically less-active winter months.
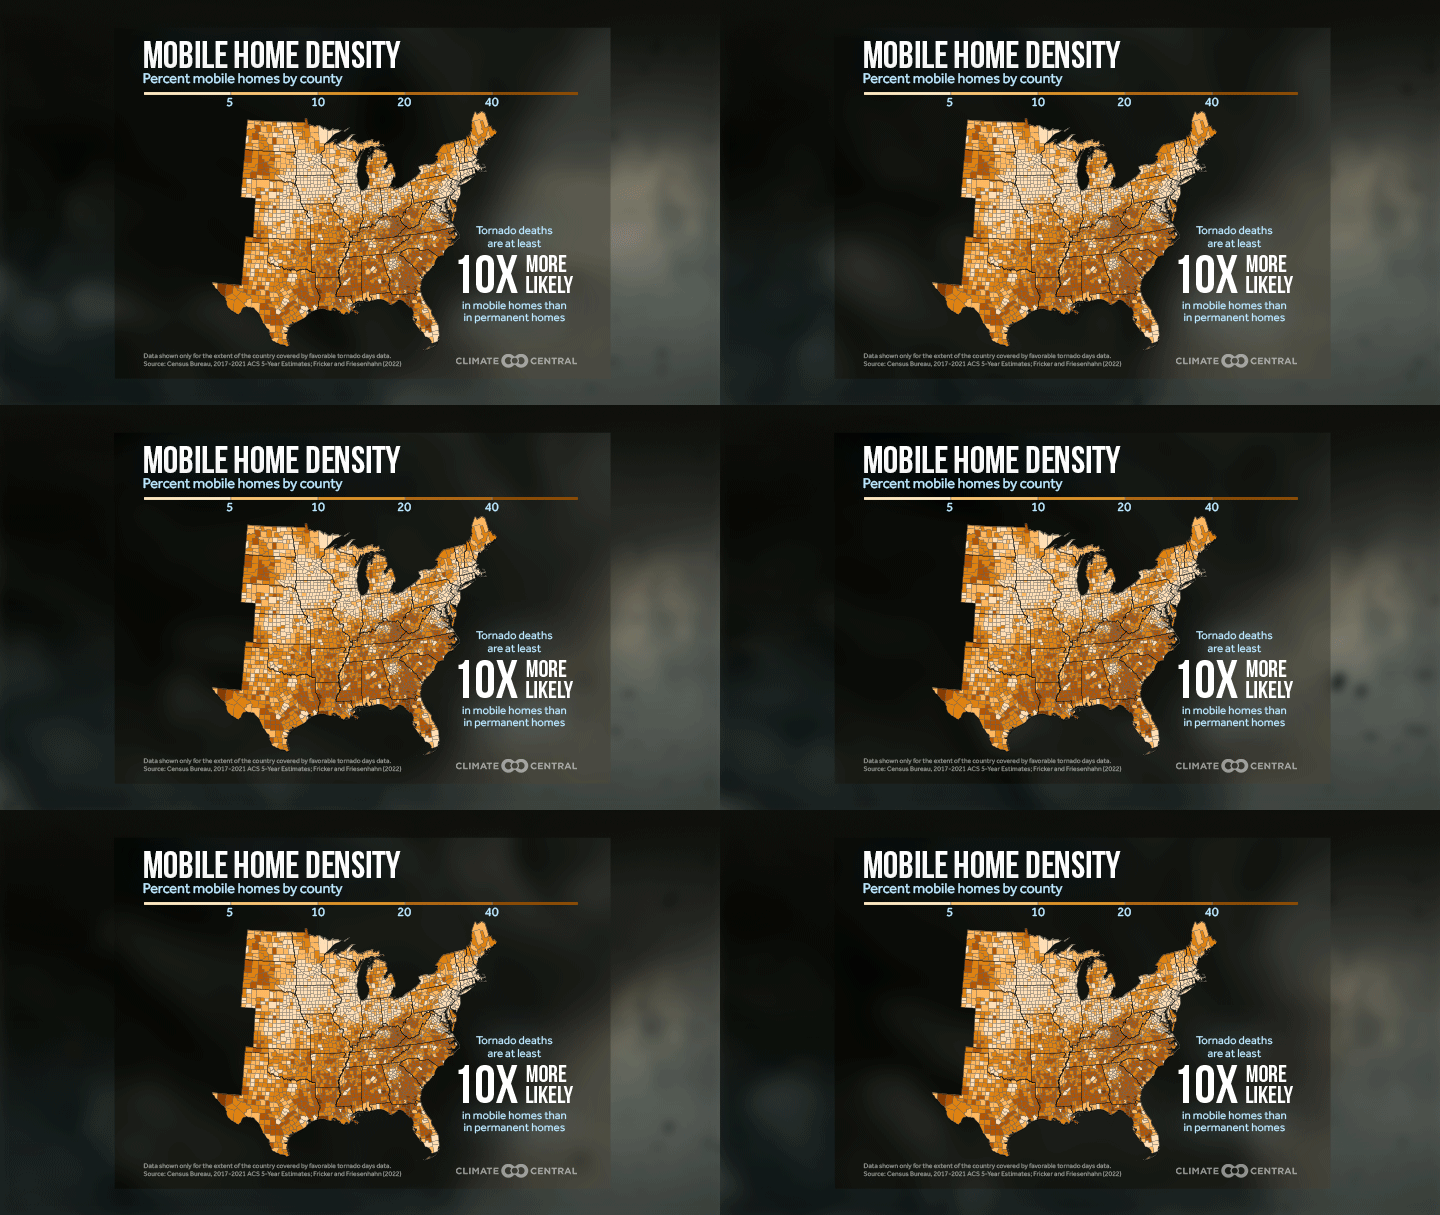
More tornado outbreaks are occurring in the Southeast and Mid-South—regions with greater mobile home density. Mobile homes are highly susceptible to tornado hazards, putting their residents at risk of tornado-related injury and mortality.

Severe weather season is off to an early, active, and deadly start. Severe storms are defined as thunderstorms that produce tornadoes, damaging winds (58 mph or higher), and/or hail. So far this year, tornadoes have taken at least 58 lives across ten states, already surpassing the annual average for tornado fatalities in the U.S. As the climate continues to warm, the nature of severe storm season is changing.

More frequent and costly billion-dollar severe storms
Severe storms account for nearly half (48%) of all billion-dollar weather disasters in the U.S. since 1980.
Since 2001, billion-dollar severe storms have caused an estimated $339 billion in damages and 1,358 fatalities in the U.S. And these costly, dangerous, and deadly storms are on the rise.
The U.S. experienced nearly six times more billion-dollar severe storms during 2001–2022 (142 events) than during the previous two decades (25 events from 1980–2000). The average annual cost of billon-dollar severe storms rose from $2.5 billion (1980–2000) to $15.4 billion (2001–2022).
Severe storm events include high winds, hailstorms, derechoes, and tornado outbreaks. Tornado outbreaks (multiple tornado occurrences closely spaced in time) inflict the highest number of fatalities and often rank among severe weather disasters that result in billion-dollar losses.

‘Tornado Alley’ shifting east, into vulnerable communities
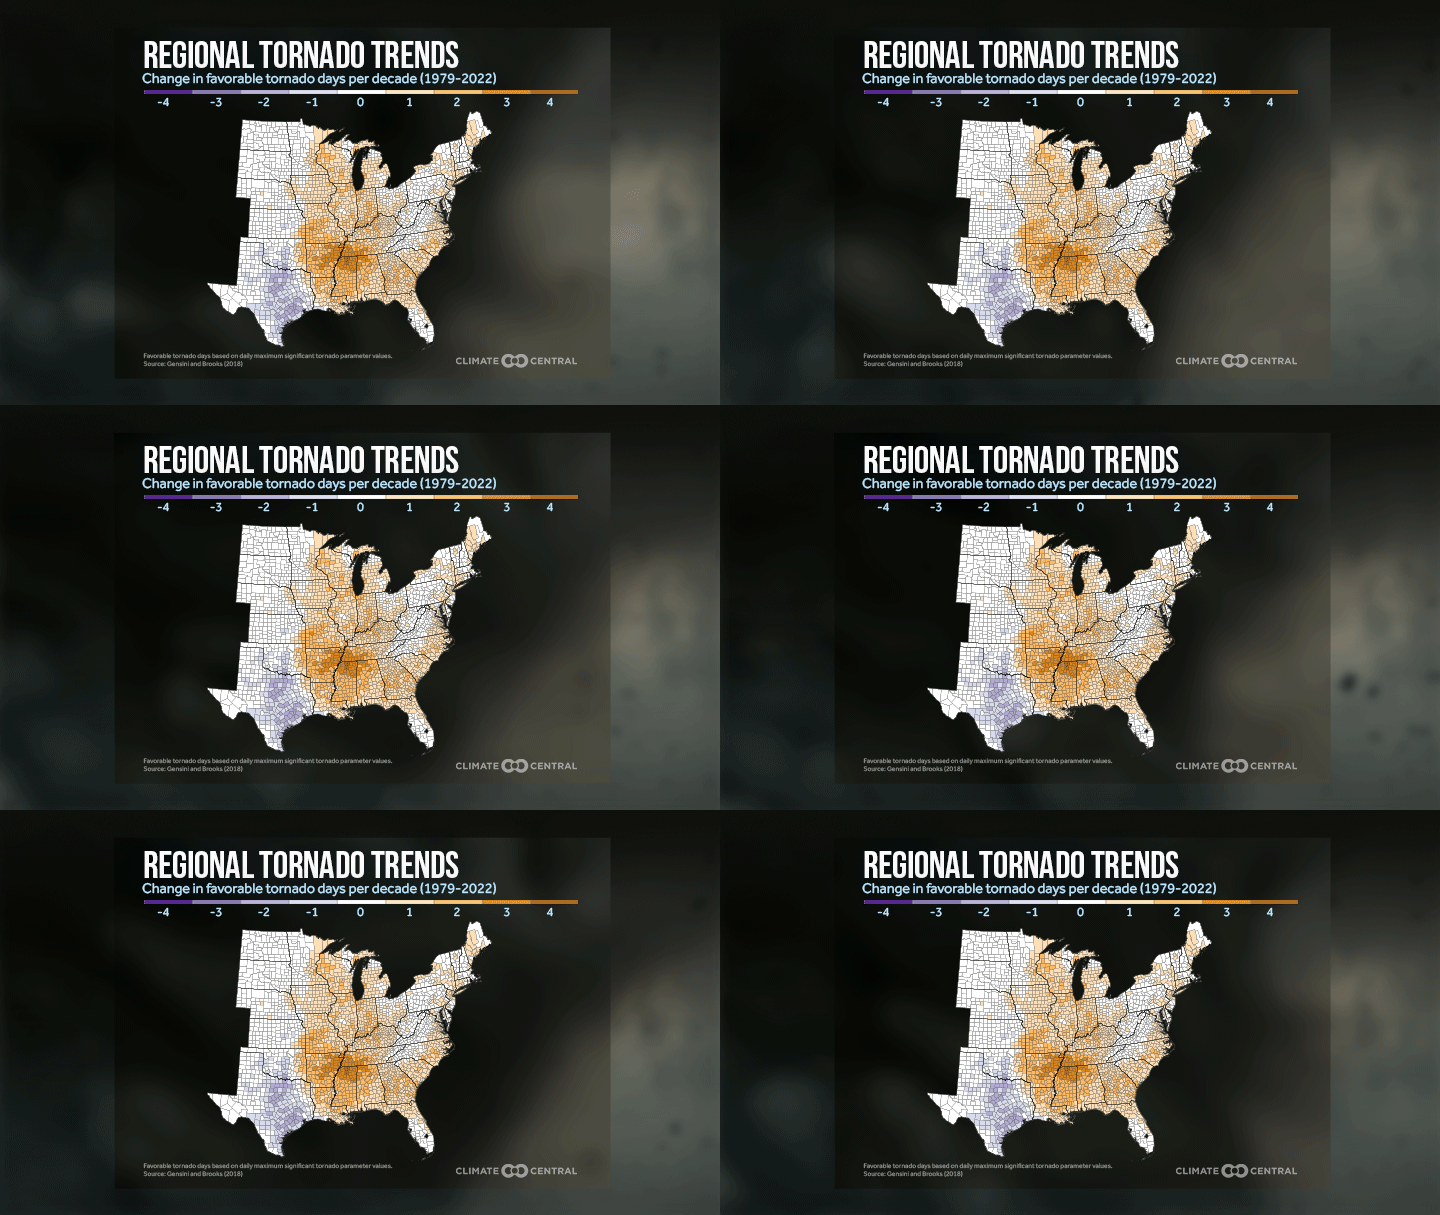
The frequency of favorable tornado days (indicated by daily maximum significant tornado parameter values) has increased significantly in parts of Mississippi, Alabama, Arkansas, Tennessee, Kentucky, Missouri, Illinois, and Indiana since 1979.
As more tornado outbreaks occur east of the Mississippi River in the Southeast and Mid-South, the boundaries of “Tornado Alley” are being redrawn. Enhanced tornado hazards, combined with increasing human exposure and socioeconomic vulnerability, can dramatically increase the risks of disastrous tornadoes in these regions.
There are over eight million mobile homes in the United States. According to a 2018 study, mobile home residents are highly susceptible to tornado impact, injury, and mortality partly because these structures are inadequate to withstand tornadic winds. The highest concentration of these homes is in the Southeast. Mobile homes account for 30 to nearly 50 percent of all homes in many counties across the Mid-South and Southeast—regions that have experienced more frequent favorable tornado conditions in recent decades. The same study determined that “mobile homes are the circumstance of death for a near majority of all tornado-related fatalities” in the Southeast and the likelihood of a tornado-related fatality in a mobile home is 15 to 20 times greater than in permanent homes.
The safety risks for mobile home residents in this region of the country are compounded by a disproportionate lack of access to tornado shelters and emergency services, as mobile homes are more commonly located in rural and remote areas far from such resources.
Changing thunderstorm potential with warming
Warm, rising air is central to the formation of thunderstorms. As the climate continues to warm, convective available potential energy (CAPE)–a measure of instability in the atmosphere–is projected to increase, which could lead to more intense storms and greater storm-related damage.
Earlier Climate Central analysis found that CAPE values have already increased (from 1979 to 2021) during spring (especially in the Ohio Valley region) and summer (especially in the Northeast).
More frequent supercells with warming
Supercells (severe thunderstorms with intense, rotating updrafts) are largely responsible for significant tornado (EF2+) formation in the continental U.S. Supercells are associated with the most extreme storm impacts, including nearly all fatal tornadoes.
A new study projects a 6.6% increase in supercell frequency nationwide by the end of the century as a result of climate warming. The study, published in January 2023, also projects an increase in supercell frequency in the eastern U.S.—a densely populated part of the country largely unfamiliar with the magnified danger associated with supercell-spawned tornadoes.
The same study also projects an increase in particularly intense storm rotation values required for long-lived, strong tornadoes in a warmer climate, under both intermediate and pessimistic greenhouse gas scenarios.
Changing seasonality of supercells and tornadoes
Conditions favorable to supercells and tornadoes are not only changing location but also expanding seasons. Climatologically, the spring and early summer months of April, May, and June are the most active for tornado formation (when ~54% of all U.S. tornadoes occur on average each year).
But the historical “tornado season” is expanding as the number of winter and early springtime tornadoes increases. From 1980–2000 to 2001–2022, the average number of wintertime (December, January, and February) tornadoes has increased 71%. March and April tornadoes have also become more frequent in this time frame with increases of 36%, and 67%, respectively.
Severe storms in a warming future
Future warming is expected to further fuel an uptick of supercells in months outside of the historical “tornado season” including more supercells in February and March by the end of the century. Increases are also expected in the early-season month of April.
The above-mentioned new study found that:
Nearly 15% more supercells are expected in February, 36% more in March, and nearly 66% more in April by 2100 under a “business as usual” climate warming scenario.
Under an intermediate warming scenario, the research projects 7% more supercells in February, 18% more in March, and nearly 37% more in April by the end of the century.
Conversely, this data also reflects a decrease in supercell formation in the months of June and July in a warmer future climate—most notably in parts of the Great Plains and lower Midwest. This decrease may be tied to a projected increase in convective inhibition, which can limit storm growth by creating a “cap” on the atmosphere. However, this could lead to more intense storms when this cap is broken (via daytime heating), by allowing for rapid storm growth and intensification.
LOCAL STORY ANGLES
Weather and climate disasters in your state or region
NOAA’s interactive Disaster Risk and Mapping tools allow you to visualize the frequency and cost of billion-dollar weather and climate events over time for individual states as well as analyze local risk and social vulnerability at the county level. The risk and vulnerability tool utilizes 29 socioeconomic variables to help gauge a community's ability to prepare for, respond to, and recover from hazards.
Is your community ready for severe weather?
NOAA’s Storm Prediction Center has local thunderstorm forecasts, active tornado watches, and multi-day severe weather outlooks. For tips on how to stay informed on the potential for severe weather and step-by-step safety sheltering instructions for mobile/manufactured home residents, see the National Weather Service’s mobile home safety guidelines.
Tools for reporting on severe weather events and disasters
Journalism schools and organizations provide advice for responsibly reporting on disasters, including focusing on safety, data, and cultural sensitivity. Be sure to check out Climate Central’s Extreme Weather Toolkit: Severe Weather (in English and Spanish) and online workshops for covering disasters.
CONTACT EXPERTS
Harold Brooks, PhD
Senior scientist, NOAA National Severe Storms Laboratory
Expertise: severe weather science
Contact: harold.brooks@noaa.gov
Robert Trapp, PhD
Head, Professor of Atmospheric Sciences
University of Illinois Urbana-Champaign
Expertise: severe weather science
Contact: jtrapp@illinois.edu
Stephen M. Strader, PhD
Associate Professor,Department of Geography and the Environment,
Villanova University
Expertise: environmental hazard risk and vulnerability, severe and hazardous weather
Contact: stephen.strader@villanova.edu
FIND EXPERTS
Submit a request to SciLine from the American Association for the Advancement of Science or to the Climate Data Concierge from Columbia University. These free services rapidly connect journalists to relevant scientific experts.
Browse maps of climate experts and services at regional NOAA, USDA, and Department of the Interior offices.
Explore databases such as 500 Women Scientists, BIPOC Climate and Energy Justice PhDs, and Diverse Sources to find and amplify diverse expert voices.
Reach out to your State Climate Office or the nearest Land-Grant University to connect with scientists, educators, and extension staff in your local area.
METHODOLOGY
The number of annual billion-dollar severe storms from 1980-2022 was obtained from NOAA/NCEI. The change in favorable tornado days (daily maximum significant tornado parameter) from 1979-2022 comes from Gensini and Brooks (2018). The county-level mobile home data was obtained from the 2017-2021 American Community Survey 5-Year Estimates. Mobile home data shown only for the extent of the country with favorable tornado days data.
Special thanks to Victor Gensini for contributing data to this release.