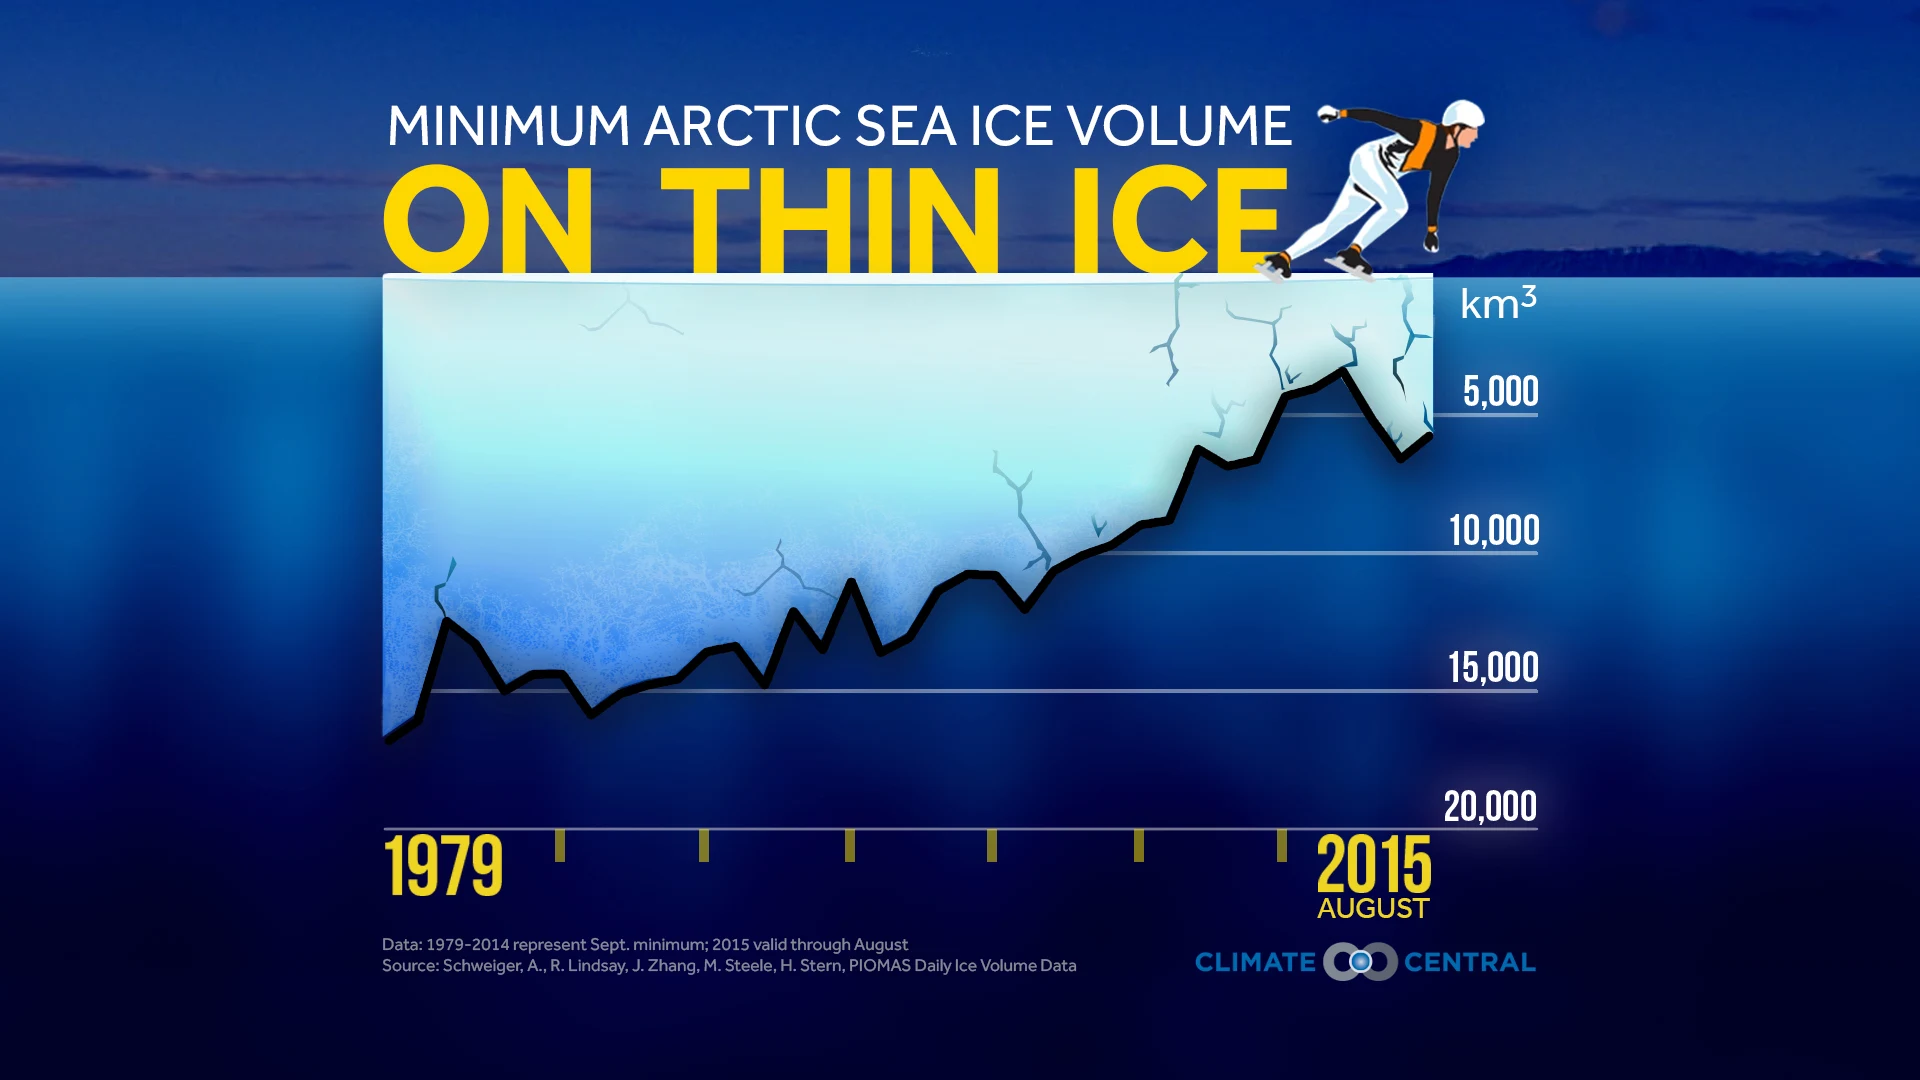


Sea ice forms and melts in the Arctic Ocean in seasonal patterns, reaching a maximum at the end of winter and a minimum at the end of summer. Its high albedo means it reflects sunlight, regulating local and global climates. However, climate change is accelerating reductions in the extent and volume of sea ice, limiting its ability to reflect the sunlight and creating further warming.
RECENT TRENDS:
This year’s Arctic sea ice minimum was about 700,000 square miles (2.5 times the size of Texas) below the 1981-2010 normal.
Last February, Arctic sea ice hit its lowest maximum extent on record, and this September it hit the fourth lowest minimumextent on record.
September Arctic ice thickness is down 85% since 1975.
Since the 1980s, old sea ice (multi-year ice) has decreased considerably. Arctic sea ice that is older than 5 years has decreased from over 30% of the total ice pack to only 8% today.
While extent is a traditional measure of sea ice, volume is also important. The lowest volume estimated this year was less than 36% of the 1979 minimum. Even though the annual minimum usually happens in mid-September, ice had already reached its 5th-lowest annual volume on record at the end August. Climate models suggest that by the end of the century, volume will decrease twice as fast as the extent.
Sea ice melt impacts local and global temperatures in a feedback loop. When the global temperature increases, Arctic ice melts faster. As this ice melts, less sunlight is reflected back to space, leading to more absorption of solar energy into the ocean and atmosphere, further increasing global temperatures. There is research showing that Arctic warming could lead to both oceanic and atmospheric changes in circulation, while also having devastating impacts to Arctic communities and their way of life.
Methodology: The Pan-Arctic Ice Ocean Modeling and Assimilation System (PIOMAS) was developed by Zhang and Rothrock and calculates Arctic sea ice volume using satellite-observed concentration data. Our analysis plots the annual minimums from this model, which is available from the Polar Science Center. Our analysis uses daily data from 1979 through August 2015.

