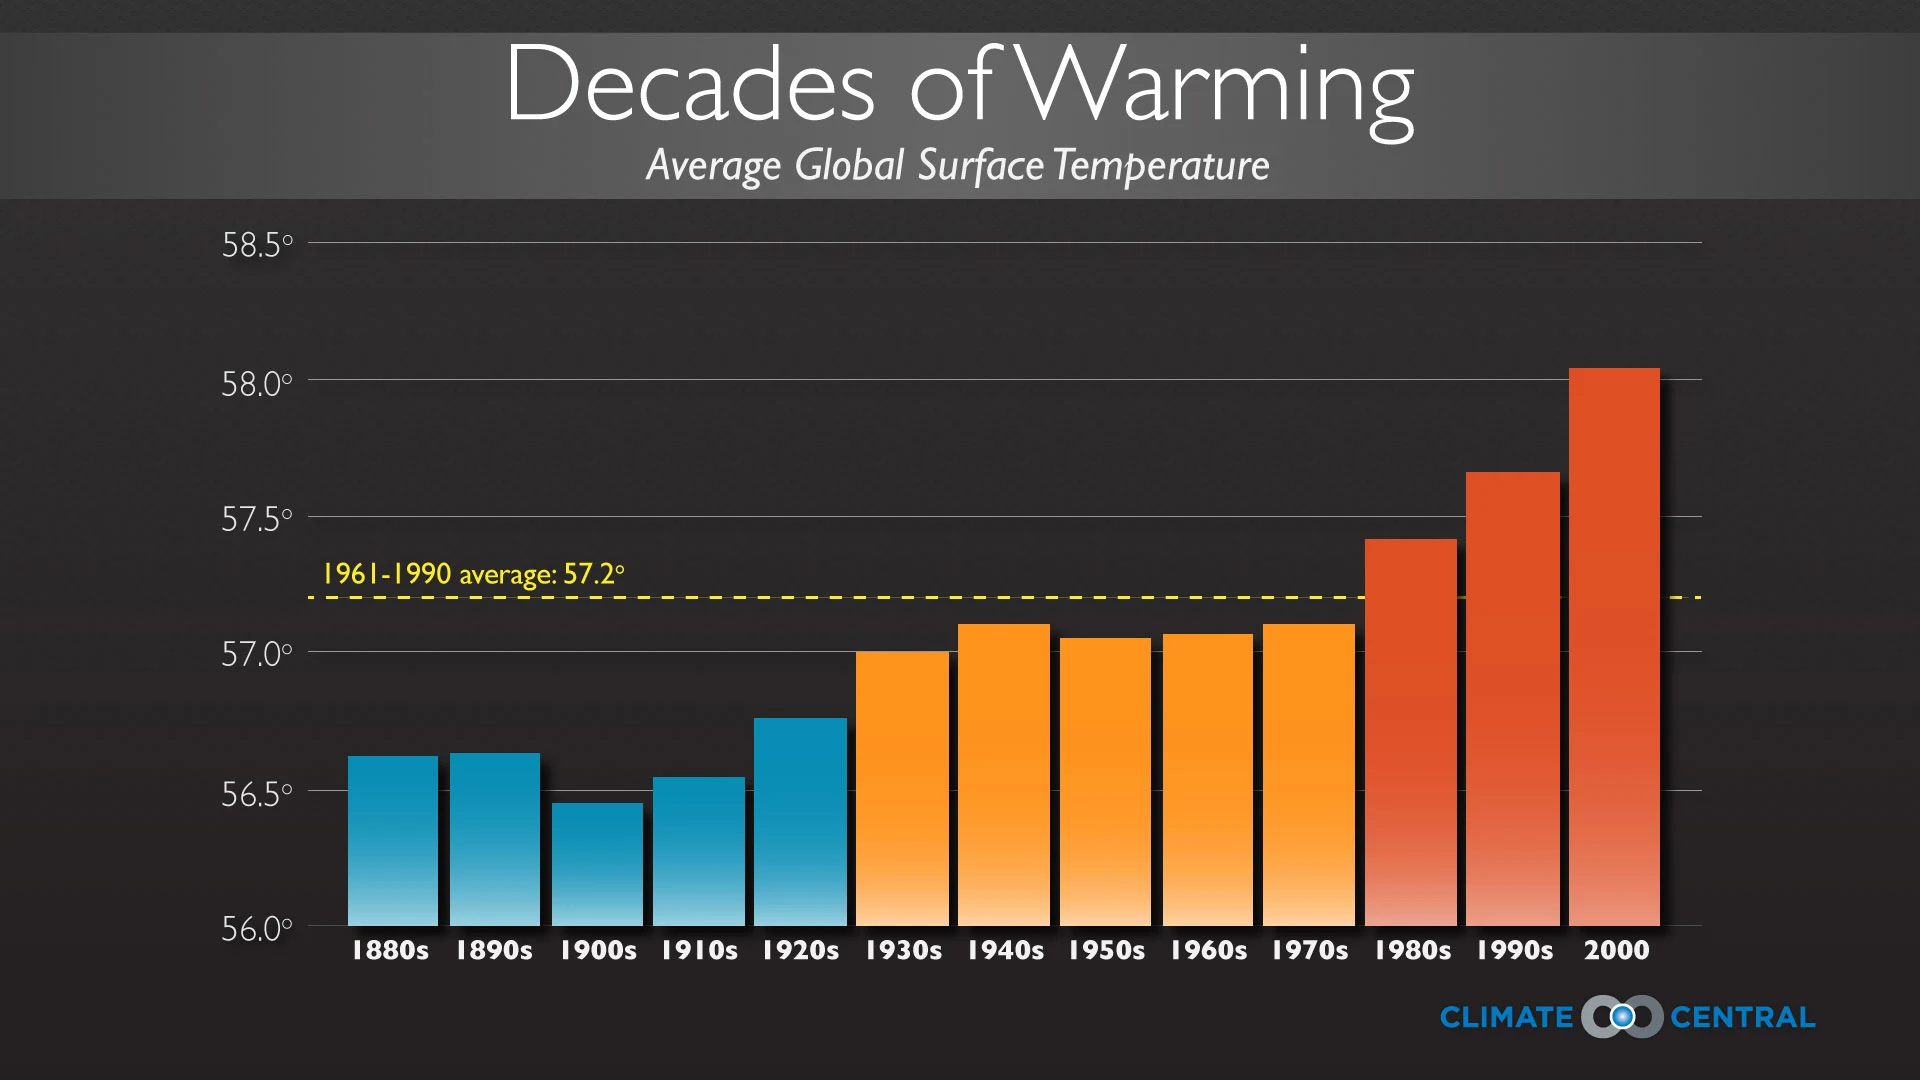

Global warming is a long term trend in rising temperatures around the world. Global temperatures averaged out annually can show trends and shed light on natural climate variability. But looking at temperatures averaged over decades can provide a clearer picture of the trend. As the graphic above shows, that long-term trend is clear - global temperatures are on the rise.
It's easy to see that there was a sharp increase in global average surface temperatures from the 1970s through the end of the 1990s. This graphic also shows that global temperatures have generally been rising since the 1880s, and despite the recent slowdown in the rate of warming, the 2000s were the hottest decade on record over the last 130 years.
The recent slowdown in global temperature rise is an area of active research. The UK’s Hadley Center released a series of three reportsdocumenting the trend, possible causes, and its implications for future climate projections. One of the most plausible reasons for the recent slowdown in warming is that the deep ocean has been acting as a heat sink, taking up more warming than the land has in recent years. The series of reports concludes: “The recent pause in global surface temperature rise does not invalidate previous estimates of climate sensitivity. Nor does it materially alter the risks of substantial warming of the Earth by the end of this century.” Another sign climate change hasn’t stopped is that other climate indicators have continued with no signs of reversing, from Arctic sea ice and glacial retreat to rising seas.
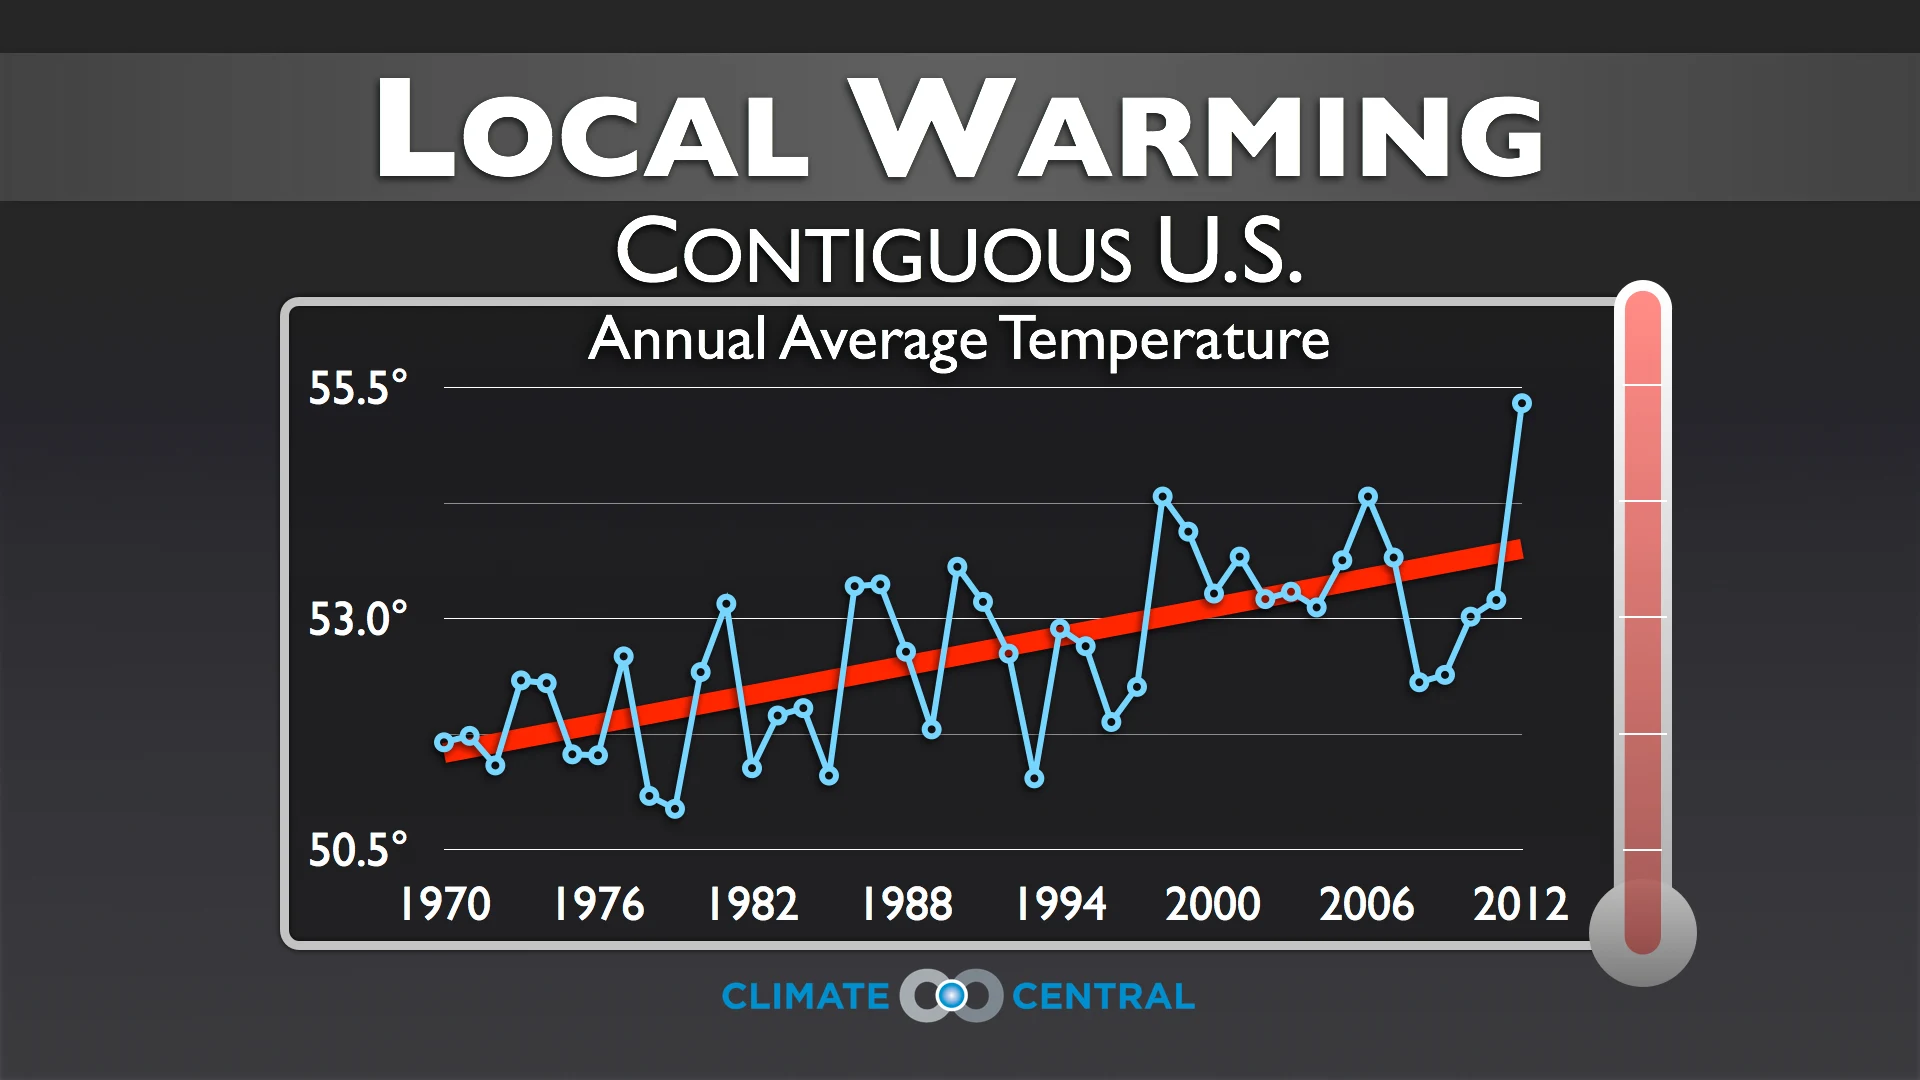
In the next two graphics, we break down the global trend to more local levels - first, for the U.S. and second, for your state. Even though there have been signs of slight cooling across the Southeast during occasional stretches, each and every state across the U.S. has been warming overall since 1970.

