Climate Matters•December 14, 2022
Daily Heat Records Rising
KEY CONCEPTS
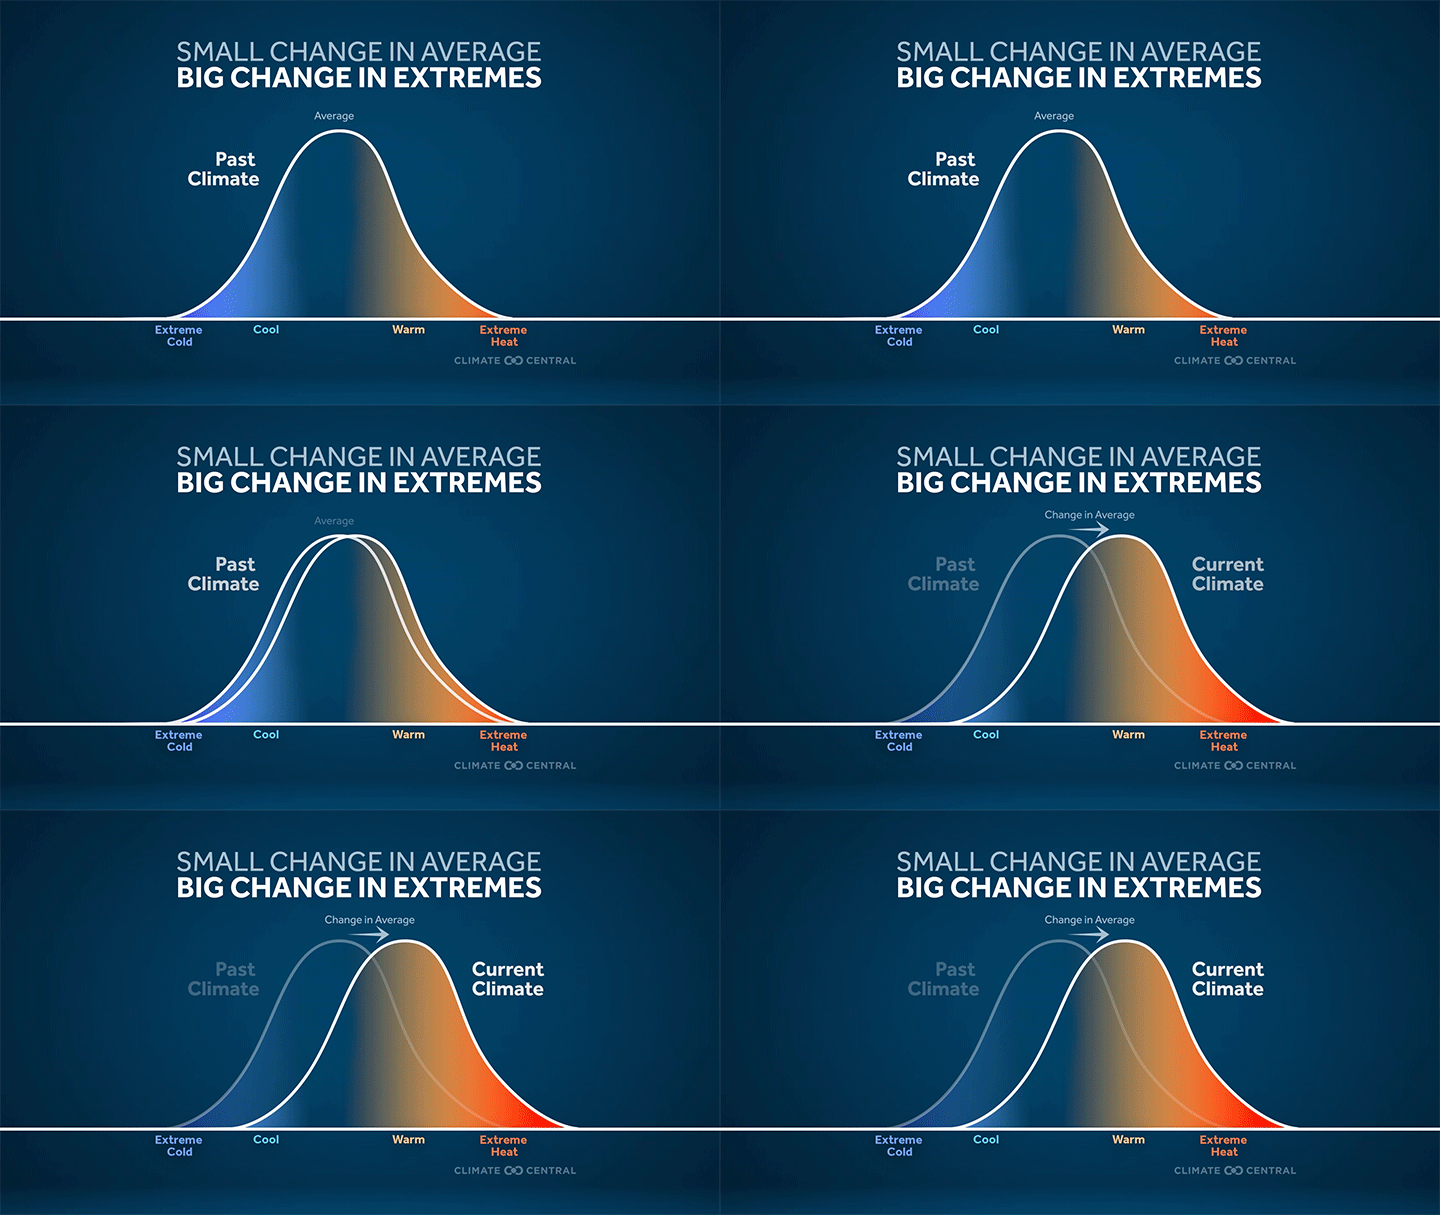
Relatively small increases in average global temperatures cause relatively large increases in daily heat extremes.
Climate Central analyzed the shifting balance between daily hot and cold records at 247 U.S. locations in recent decades.
Most local observations follow the global trend, with heat records outnumbering cold records in recent years.
Local trends toward more record heat than cold are an indicator of climate change, and heat extremes put people and ecosystems at risk.

Small change in average, big change in extremes
Last month’s UN climate conference was the 27th annual gathering of tens of thousands of attendees representing 200 countries in pursuit of a global goal: to keep warming well below 2°C (3.6°F).
At first glance, 3.6°F may not seem like a significant amount of warming. Locally, temperatures fluctuate far more than that from day to night or winter to summer. But as a global average, the 3.6°F warming limit represents a very consequential amount of warming.
The risks for people, economies, and ecosystems across the planet rise with every fraction of a degree of average global warming. To understand why, it’s important to recognize that a relatively small increase in average temperatures causes a relatively large increase in the frequency and severity of extreme heat.

Local temperature extremes
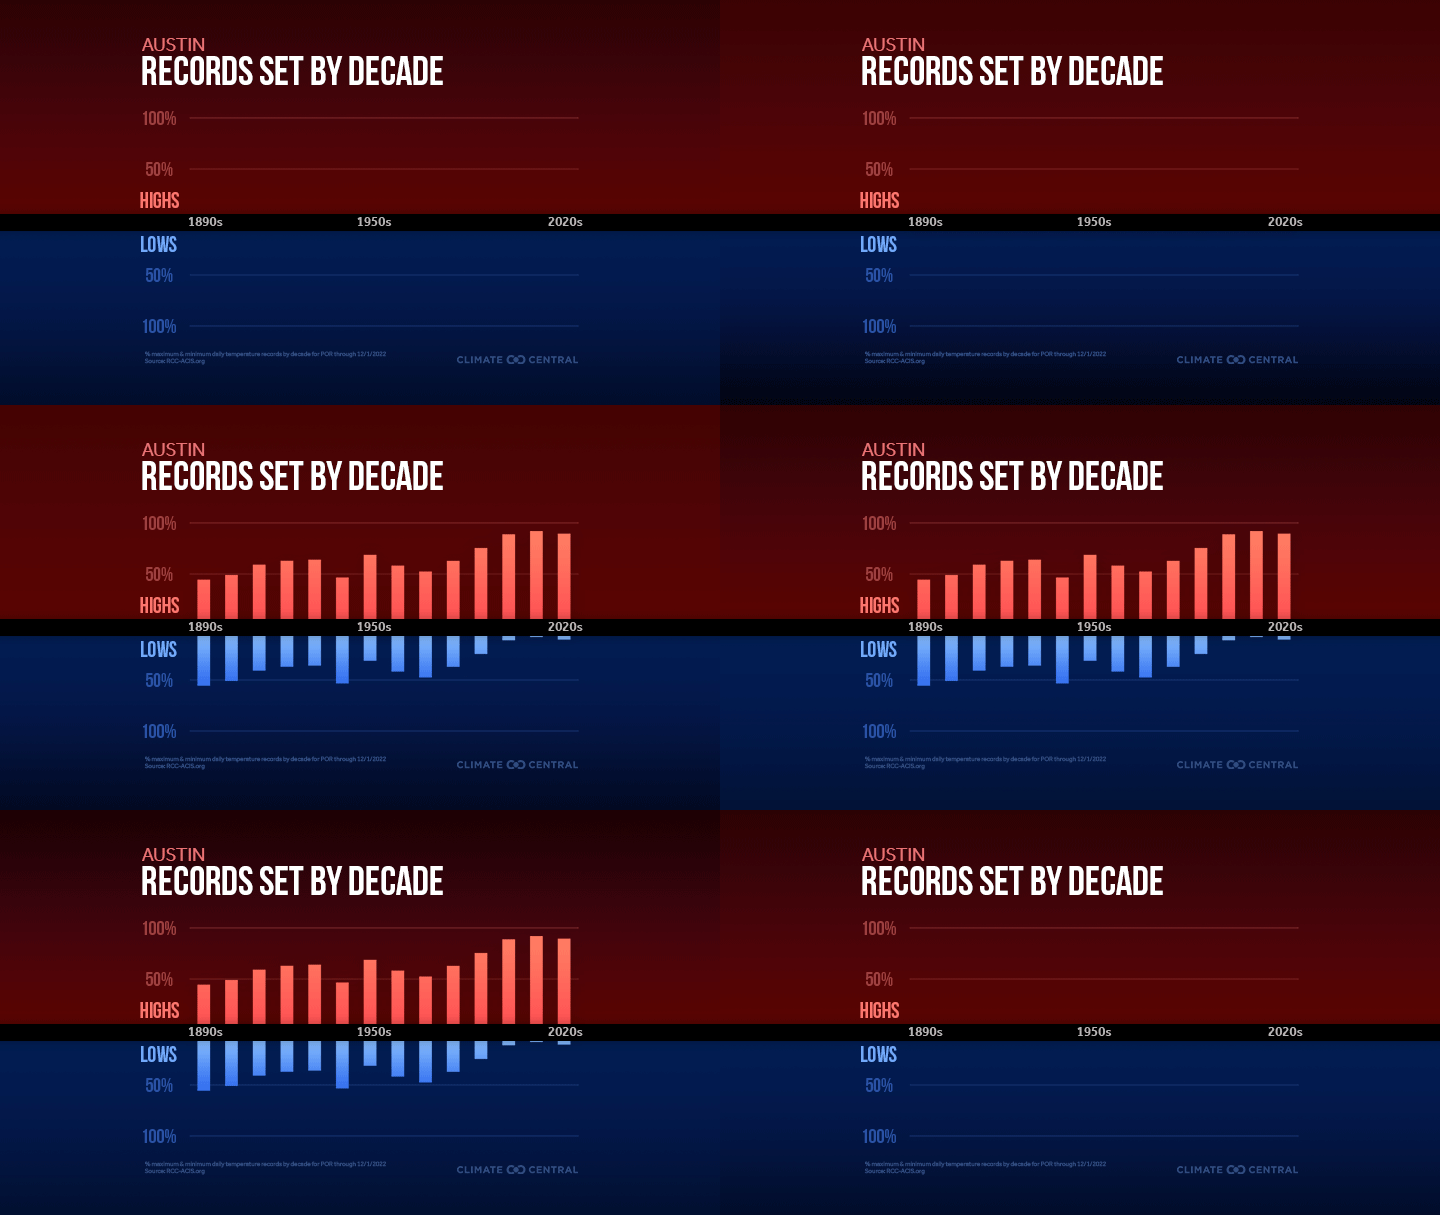
To show how long-term global warming has affected local temperature extremes, Climate Central analyzed daily temperature records for the entire calendar day over the entire period of record at 247 U.S. locations (see Methodology section). Local graphics show the percentage of hot and cold records set each decade, and in 2020, 2021, and 2022 (through November).
Most local observations follow the global trend, with heat records outnumbering cold records in recent years. Here are some highlights:
In the 2010s, 96% of 247 locations set more heat records than cold records. A century prior, during the 1910s, 54% of locations set more heat records than cold records.
From January 2020 through November 2022, 91% of 245 locations had more record heat than record cold.
Over the same period, 25 locations across the U.S. only set records for heat (none for cold). Tampa, Fla. had the greatest imbalance (setting 76 heat records and no cold records)—followed by Miami, Fla. (52 heat records), Phoenix, Ariz. (47), Reno, Nev. (45), and San Francisco, Calif. (36).
Heat records aren’t all about summer. As every season warms, unusually hot temperature records are being set year-round, including during colder months.
The Great Plains Dust Bowl drought of the 1930s marked a period of extraordinary heat extremes in the U.S. During the 1930’s, warm season (May-August) daily heat records outpaced daily cold records at rates not seen again until the 2010s. Data so far for the 2020s indicate that rates of record-setting heat in the current decade may exceed those seen during the 1930s.
Changing climate, changing extremes
Record-setting temperatures are part of expected variation in daily weather. But as the planet warms overall, heat extremes are expected to become more frequent and more intense (see Extreme Heat Toolkit).
In a stable climate, extreme highs and lows would each account for about half of all records. But since the late 1970s, daily heat records have become increasingly more common than daily cold records across the U.S.—a trend that is projected to increase with additional warming.
The observed local trends toward more record heat than cold is a hallmark of climate change as the global average temperature increases. At a national scale, daily heat records have become at least twice as frequent as daily cold records. According to NOAA, in 2022 so far (through December 13), the U.S. has experienced about twice as many daily heat records than cold records.
Unusually hot summer days and nights have become more frequent since the 1970s. Human-caused warming has already increased the likelihood of record-shattering heat extremes such as the June 2021 Pacific Northwest heat wave that led to heat-related hospitalizations and sparked wildfire.
If heat-trapping emissions continue, such record-shattering heat extremes are projected to become longer, hotter, and more likely with each decade. By contrast, cold extremes (particularly very cold nights) are becoming less frequent and milder and now occur over a smaller area.
Trends in daily temperature extremes in the U.S. are also reflected at global scales. The latest IPCC reports conclude that it is virtually certain that “the frequency and intensity of hot extremes (including heatwaves) have increased and those of cold extremes have decreased on the global scale from 1950”.
Annual temperature extremes have warmed significantly in nearly every region of the planet since 1960—with the fastest rates of warming during the coldest times of year.
Extreme heat: impacts and solutions
Extreme heat is the deadliest form of weather in the U.S. And if average temperatures continue to warm, the frequency and severity of harmful heat—including humid heat—are also expected to increase, putting vulnerable groups and urban populations at particular risk.
More frequent and intense temperature extremes can also increase the risks of other types of extreme events such as droughts and wildfires. The resulting compound hazards can worsen the risks for health, agriculture, water supplies, ecosystems, coastal communities, and infrastructure. Many of these climate-related risks worsen with every additional bit of global warming—one of the key motivations behind global efforts to limit that average warming to well below 2°C (3.6°F).
The good news is that scientists have already identified many solutions to slow recent rates of global warming and meet that goal. Climate Central’s Solutions Series reviews many of these options and their local benefits—from wind and solar energy production to low-carbon transport and homes, enhancing soil carbon storage, and cutting planet-warming methane emissions.
POTENTIAL LOCAL STORY ANGLES
Did climate change influence daily heat records in your local area?
Climate Central’s Climate Shift Index (CSI-USA) tool provides real-time estimates of how much climate change is affecting daily high and low temperatures across the entire U.S. Access the free tool anytime to see just how much climate change has altered the daytime and nighttime temperatures you’re experiencing today—and the temperatures your area is forecasted to experience tomorrow and the day after as well. The Global Climate Shift Index (CSI-Global) maps the influence of climate change on daily average temperatures across the entire globe.
How is extreme heat affecting health and who is most at risk?
The 2018 National Climate Assessment details how the rise of extreme heat is already impacting health. The CDC maps heat-related illnesses in its heat and health tracker. To identify the most vulnerable counties check out this extreme heat vulnerability mapping tool that combines NOAA projected heat events and CDC's Social Vulnerability Index (SVI).
For more local temperature rankings:
NOAA Climate at a Glance provides local temperature rankings, maps, and time series plots at national, regional, state, and city levels. NOAA’s Daily Weather Records tool provides custom reports and national summaries on daily temperature records for a range of parameters, dates, and U.S. locations.
LOCAL EXPERTS
The SciLine service, 500 Women Scientists or the press offices of local universities may be able to connect you with local scientists who have expertise on extreme heat and climate change. The American Association of State Climatologists is a professional scientific organization composed of all state climatologists.
NATIONAL EXPERTS
Cascade Tuholske, PhD
Assistant Professor of Human-Environment Geography
Montana State University
Related expertise: urban extreme heat exposure
Contact: cascade.tuholske1@montana.edu
Scott Sheridan, PhD
Professor and Chairperson
Department of Geography, Kent State University
Related expertise: extreme heat trends and vulnerability
Contact: ssherid1@kent.edu
METHODOLOGY
Series of daily records, based on the same calendar day in the past, were identified each year since the start of the period of record, then aggregated by decade. To be clear, this not only represents the location’s current record for each calendar day, but a total count of the records as they happened since that station thread was established. This series is based on Threadex data, when available, so it represents each of the local historic records as accounted by NOAA/NCEI; records over time may include station relocations, corresponding with the NOAA supported records. Records for 2020, 2021, and 2022 (January through November) are included as a partial decade. Greenville, Miss. and Presque Isle, Maine. were excluded from the 2020-2022 analysis due to missing data.