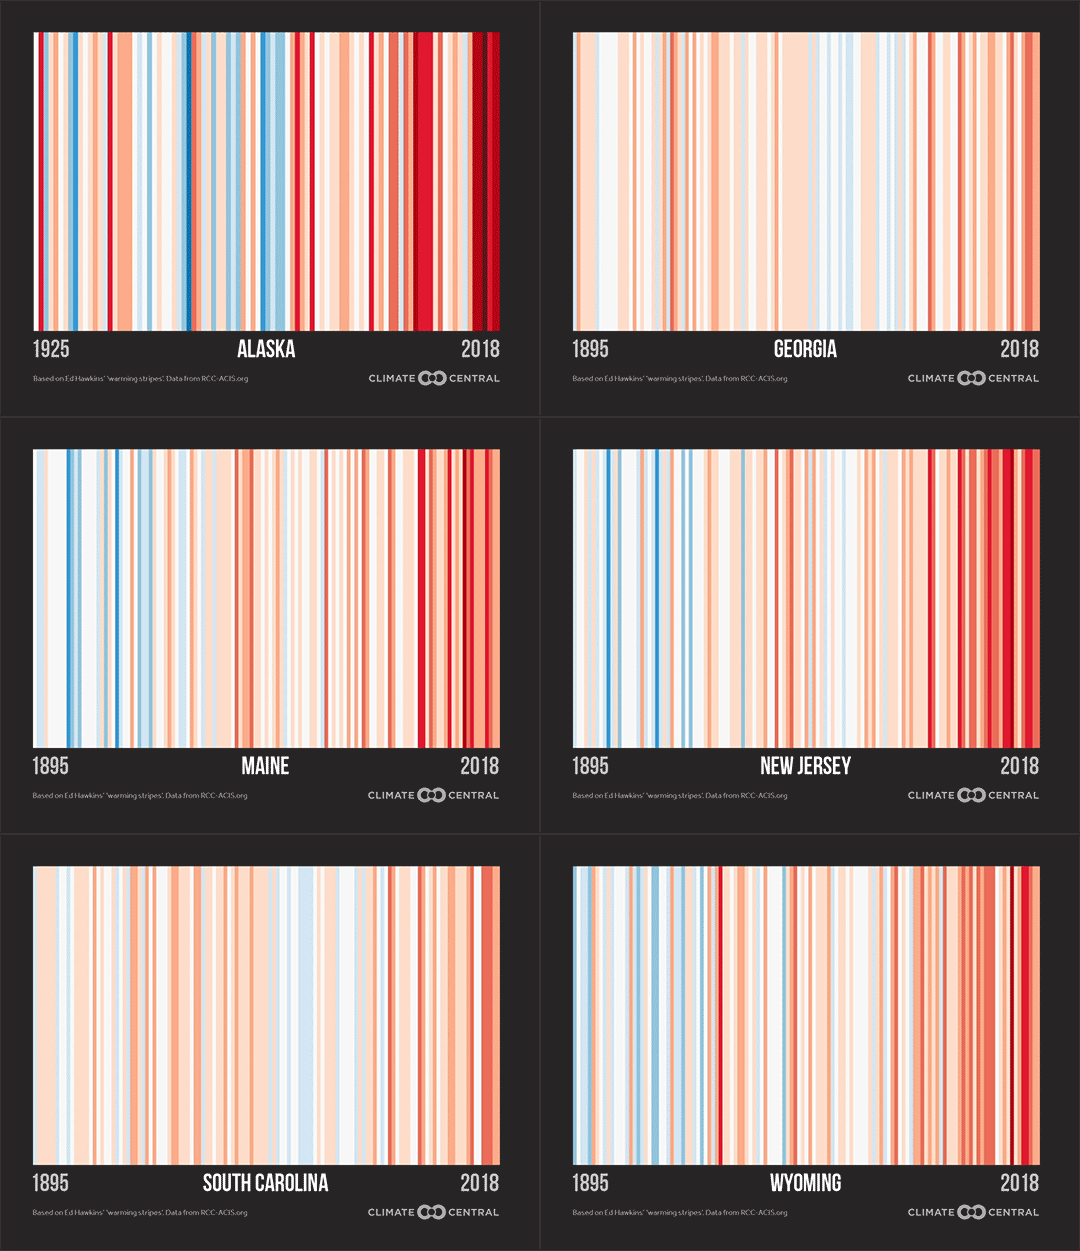
It’s time to #ShowYourStripes as #MetsUnite to communicate climate change! On the Summer Solstice this Friday, join hundreds of meteorologists by sharing your city’s or state’s “warming stripes.”
Warming Stripes - Cities
Friday marks the summer solstice — and with it, the second year of #MetsUnite. Last June, more than 100 meteorologists across the planet took part in sending a united message on climate change. Sporting the now-iconic “warming stripes” pattern on items like neckties and necklaces, they communicated a clear concept — Earth’s warming is accelerating fast.Warming Stripes - States
This year, Climate Central and scientist Ed Hawkins have expanded on the original blue-to-red visual. Each stripe represents a yearly temperature anomaly, trending red-hot towards the data’s end in 2018. These “warming stripes” are now available for 160 of our 244 regularly analyzed cities. For cities that lacked a sufficient period of record, graphics for U.S. states are also available. Most places depict a clear warming trend, especially in the Southwest, Northeast, and Alaska — in line with our previous analysis of the fastest-warming cities and states.
Find and Download All City, State, and International Stripes Images
Warming provokes a wide range of climate impacts, both local and global. It’s already increasing the frequency and intensity of extreme weather, harming health, stressing food and water supplies, shifting seasons and ecosystems, elevating sea levels, damaging infrastructure and economies, and threatening ways of life. Curbing these hazards may be the greatest challenge of our time, but mitigating solutions exist from renewable energy to cleaner and agriculture.
Talking about climate change can help, too. About two of three Americans are interested in learning more about climate change, but fewer than half think it will harm them personally. Meteorologists are uniquely positioned to improve viewers’ understanding.
Here’s how you can get involved on Friday, June 21:
Download and display your area’s “warming stripes” on air and/or social media with a message about climate change in your community — from impacts to solutions. Use the hashtags #MetsUnite and #ShowYourStripes.
Update your social accounts with “warming stripes” graphics including a Facebook camera filter, a Facebook frame for your profile image, and cover photos for Twitter, Facebook, and LinkedIn.
If you’d like to join your fellow meteorologists in showing “warming stripes” ties, earrings, coffee mugs, and more on air, click here to purchase an item.
Explore this interactive developed by Jared Rennie from North Carolina Institute for Climate Studies, showing your warming stripes down to the county level.
For more information on the “Show Your Stripes” initiative, visit https://showyourstripes.info/ (international stripes) or MetsUnite.com
METHODOLOGY: Stripes for stations and states are based on the anomaly from the 20th century average. For a subset of locations where there was no data until after 1901, the anomaly is based on the oldest 100-year average available for that city. Stations with less than 100 years of data were not included. Station data is from RCC-ACIS and state data is from NCDC Climate at a Glance.

